Tsimshian vs Immigrants from Dominica Unemployment
COMPARE
Tsimshian
Immigrants from Dominica
Unemployment
Unemployment Comparison
Tsimshian
Immigrants from Dominica
7.2%
UNEMPLOYMENT
0.0/ 100
METRIC RATING
328th/ 347
METRIC RANK
6.7%
UNEMPLOYMENT
0.0/ 100
METRIC RATING
316th/ 347
METRIC RANK
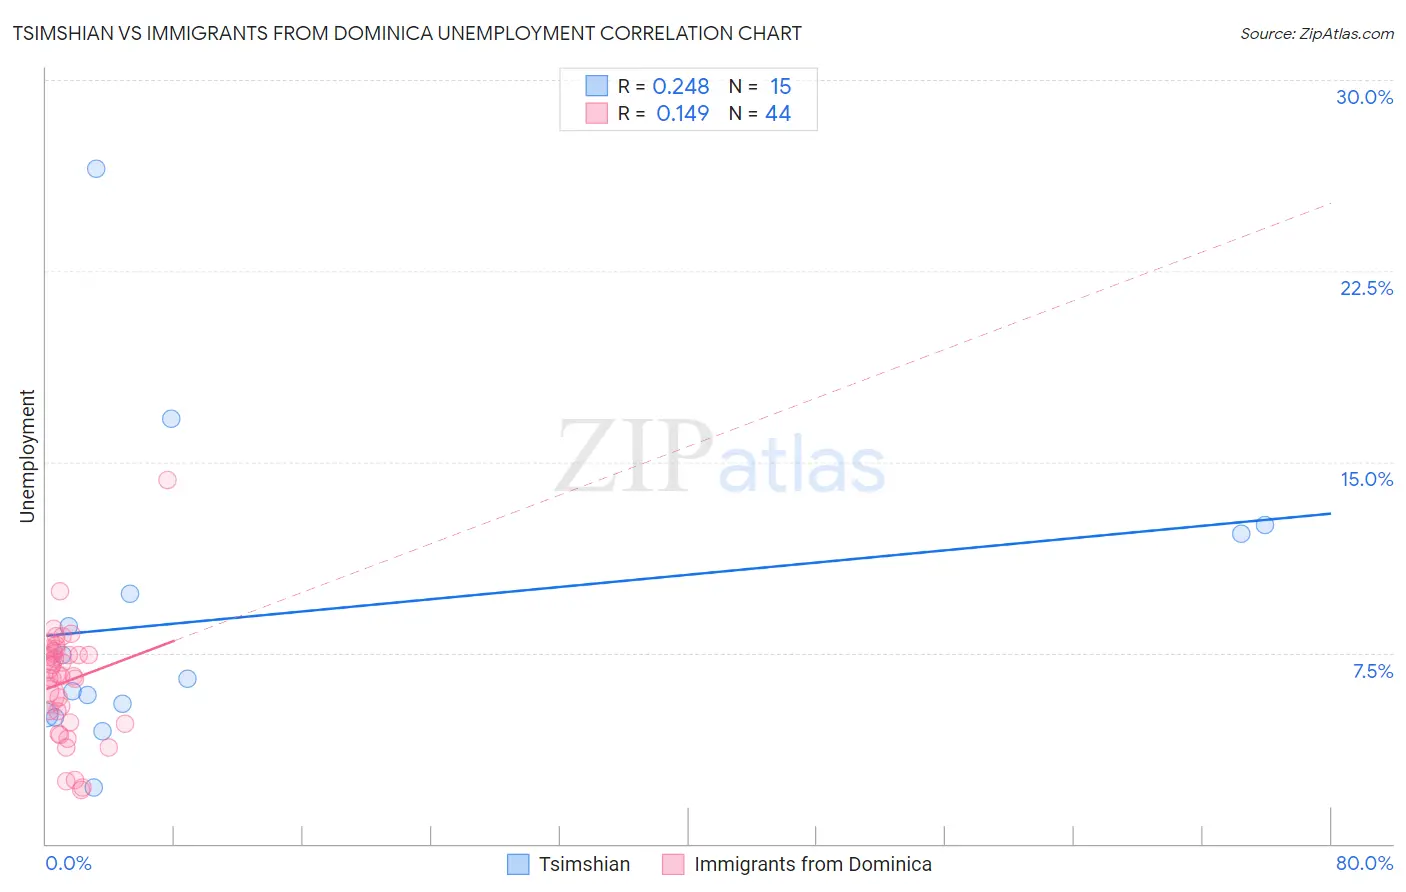
Tsimshian vs Immigrants from Dominica Unemployment Correlation Chart
The statistical analysis conducted on geographies consisting of 15,625,029 people shows a weak positive correlation between the proportion of Tsimshian and unemployment in the United States with a correlation coefficient (R) of 0.248 and weighted average of 7.2%. Similarly, the statistical analysis conducted on geographies consisting of 83,789,741 people shows a poor positive correlation between the proportion of Immigrants from Dominica and unemployment in the United States with a correlation coefficient (R) of 0.149 and weighted average of 6.7%, a difference of 7.1%.
Unemployment Correlation Summary
| Measurement | Tsimshian | Immigrants from Dominica |
| Minimum | 2.2% | 2.1% |
| Maximum | 26.5% | 14.3% |
| Range | 24.3% | 12.2% |
| Mean | 8.9% | 6.4% |
| Median | 6.5% | 6.6% |
| Interquartile 25% (IQ1) | 5.1% | 5.0% |
| Interquartile 75% (IQ3) | 12.2% | 7.5% |
| Interquartile Range (IQR) | 7.1% | 2.5% |
| Standard Deviation (Sample) | 6.1% | 2.2% |
| Standard Deviation (Population) | 5.9% | 2.2% |
Demographics Similar to Tsimshian and Immigrants from Dominica by Unemployment
In terms of unemployment, the demographic groups most similar to Tsimshian are Alaska Native (7.2%, a difference of 0.31%), Pueblo (7.2%, a difference of 0.91%), Paiute (7.1%, a difference of 1.4%), Yakama (7.3%, a difference of 1.6%), and Dominican (7.4%, a difference of 1.9%). Similarly, the demographic groups most similar to Immigrants from Dominica are Shoshone (6.8%, a difference of 0.58%), Houma (6.7%, a difference of 0.83%), Immigrants from Cabo Verde (6.8%, a difference of 1.2%), British West Indian (6.8%, a difference of 1.4%), and Black/African American (6.6%, a difference of 1.6%).
| Demographics | Rating | Rank | Unemployment |
| Colville | 0.0 /100 | #312 | Tragic 6.6% |
| Immigrants | Barbados | 0.0 /100 | #313 | Tragic 6.6% |
| Blacks/African Americans | 0.0 /100 | #314 | Tragic 6.6% |
| Houma | 0.0 /100 | #315 | Tragic 6.7% |
| Immigrants | Dominica | 0.0 /100 | #316 | Tragic 6.7% |
| Shoshone | 0.0 /100 | #317 | Tragic 6.8% |
| Immigrants | Cabo Verde | 0.0 /100 | #318 | Tragic 6.8% |
| British West Indians | 0.0 /100 | #319 | Tragic 6.8% |
| Immigrants | St. Vincent and the Grenadines | 0.0 /100 | #320 | Tragic 6.9% |
| Immigrants | Guyana | 0.0 /100 | #321 | Tragic 6.9% |
| Guyanese | 0.0 /100 | #322 | Tragic 6.9% |
| Immigrants | Grenada | 0.0 /100 | #323 | Tragic 6.9% |
| Immigrants | Armenia | 0.0 /100 | #324 | Tragic 7.0% |
| Natives/Alaskans | 0.0 /100 | #325 | Tragic 7.0% |
| Paiute | 0.0 /100 | #326 | Tragic 7.1% |
| Pueblo | 0.0 /100 | #327 | Tragic 7.2% |
| Tsimshian | 0.0 /100 | #328 | Tragic 7.2% |
| Alaska Natives | 0.0 /100 | #329 | Tragic 7.2% |
| Yakama | 0.0 /100 | #330 | Tragic 7.3% |
| Dominicans | 0.0 /100 | #331 | Tragic 7.4% |
| Sioux | 0.0 /100 | #332 | Tragic 7.4% |