Alaskan Athabascan vs Immigrants from Dominica Female Poverty

COMPARE

Alaskan Athabascan
Race
Ancestry
AfghanAfricanAlaska NativeAlaskan AthabascanAlbanianAleutAlsatianAmericanApacheArabArapahoArgentineanArmenianAssyrian/Chaldean/SyriacAustralianAustrianBahamianBangladeshiBarbadianBasqueBelgianBelizeanBermudanBhutaneseBlackfeetBolivianBrazilianBritishBritish West IndianBulgarianBurmeseCajunCambodianCanadianCape VerdeanCarpatho RusynCelticCentral AmericanCentral American IndianCherokeeCheyenneChickasawChileanChineseChippewaChoctawColombianColvilleComancheCosta RicanCreeCreekCroatianCrowCubanCypriotCzechCzechoslovakianDanishDelawareDominicanDutchDutch West IndianEastern EuropeanEcuadorianEgyptianEnglishEstonianEthiopianEuropeanFijianFilipinoFinnishFrenchFrench American IndianFrench CanadianGermanGerman RussianGhanaianGreekGuamanian/ChamorroGuatemalanGuyaneseHaitianHmongHonduranHopiHoumaHungarianIcelanderIndian (Asian)IndonesianInupiatIranianIraqiIrishIroquoisIsraeliItalianJamaicanJapaneseJordanianKenyanKiowaKoreanLaotianLatvianLebaneseLiberianLithuanianLumbeeLuxembourgerMacedonianMalaysianMalteseMarshalleseMenomineeMexicanMexican American IndianMongolianMoroccanNative HawaiianNavajoNepaleseNew ZealanderNicaraguanNigerianNorthern EuropeanNorwegianOkinawanOsageOttawaPaiutePakistaniPalestinianPanamanianParaguayanPennsylvania GermanPeruvianPimaPolishPortuguesePotawatomiPuebloPuerto RicanPuget Sound SalishRomanianRussianSalvadoranSamoanScandinavianScotch-IrishScottishSeminoleSenegaleseSerbianShoshoneSierra LeoneanSiouxSlavicSlovakSloveneSomaliSouth AfricanSouth AmericanSouth American IndianSoviet UnionSpaniardSpanishSpanish AmericanSpanish American IndianSri LankanSubsaharan AfricanSudaneseSwedishSwissSyrianTaiwaneseThaiTlingit-HaidaTohono O'OdhamTonganTrinidadian and TobagonianTsimshianTurkishU.S. Virgin IslanderUgandanUkrainianUruguayanUteVenezuelanVietnameseWelshWest IndianYakamaYaquiYugoslavianYumanYup'ikZimbabwean
Immigration
NonimmigrantsImmigrantsAfghanistanAfricaAlbaniaArgentinaArmeniaAsiaAustraliaAustriaBahamasBangladeshBarbadosBelarusBelgiumBelizeBoliviaBosnia and HerzegovinaBrazilBulgariaBurma/MyanmarCabo VerdeCambodiaCameroonCanadaCaribbeanCentral AmericaChileChinaColombiaCongoCosta RicaCroatiaCubaCzechoslovakiaDenmarkDominican RepublicEastern AfricaEastern AsiaEastern EuropeEcuadorEgyptEl SalvadorEnglandEritreaEthiopiaEuropeFijiFranceGermanyGhanaGreeceGrenadaGuatemalaGuyanaHaitiHondurasHong KongHungaryIndiaIndonesiaIranIraqIrelandIsraelItalyJamaicaJapanJordanKazakhstanKenyaKoreaKuwaitLaosLatin AmericaLatviaLebanonLiberiaLithuaniaMalaysiaMexicoMicronesiaMiddle AfricaMoldovaMoroccoNepalNetherlandsNicaraguaNigeriaNorth AmericaNorth MacedoniaNorthern AfricaNorthern EuropeNorwayOceaniaPakistanPanamaPeruPhilippinesPolandPortugalRomaniaRussiaSaudi ArabiaScotlandSenegalSerbiaSierra LeoneSingaporeSomaliaSouth AfricaSouth AmericaSouth Central AsiaSouth Eastern AsiaSouthern EuropeSpainSri LankaSt. Vincent and the GrenadinesSudanSwedenSwitzerlandSyriaTaiwanThailandTrinidad and TobagoTurkeyUgandaUkraineUruguayUzbekistanVenezuelaVietnamWest IndiesWestern AfricaWestern AsiaWestern EuropeYemenZaireZimbabweAzores
Immigrants from Dominica
Race
Ancestry
AfghanAfricanAlaska NativeAlbanianAleutAlsatianAmericanApacheArabArapahoArgentineanArmenianAssyrian/Chaldean/SyriacAustralianAustrianBahamianBangladeshiBarbadianBasqueBelgianBelizeanBermudanBhutaneseBlackfeetBolivianBrazilianBritishBritish West IndianBulgarianBurmeseCajunCambodianCanadianCape VerdeanCarpatho RusynCelticCentral AmericanCentral American IndianCherokeeCheyenneChickasawChileanChineseChippewaChoctawColombianColvilleComancheCosta RicanCreeCreekCroatianCrowCubanCypriotCzechCzechoslovakianDanishDelawareDominicanDutchDutch West IndianEastern EuropeanEcuadorianEgyptianEnglishEstonianEthiopianEuropeanFijianFilipinoFinnishFrenchFrench American IndianFrench CanadianGermanGerman RussianGhanaianGreekGuamanian/ChamorroGuatemalanGuyaneseHaitianHmongHonduranHopiHoumaHungarianIcelanderIndian (Asian)IndonesianInupiatIranianIraqiIrishIroquoisIsraeliItalianJamaicanJapaneseJordanianKenyanKiowaKoreanLaotianLatvianLebaneseLiberianLithuanianLumbeeLuxembourgerMacedonianMalaysianMalteseMarshalleseMenomineeMexicanMexican American IndianMongolianMoroccanNative HawaiianNavajoNepaleseNew ZealanderNicaraguanNigerianNorthern EuropeanNorwegianOkinawanOsageOttawaPaiutePakistaniPalestinianPanamanianParaguayanPennsylvania GermanPeruvianPimaPolishPortuguesePotawatomiPuebloPuerto RicanPuget Sound SalishRomanianRussianSalvadoranSamoanScandinavianScotch-IrishScottishSeminoleSenegaleseSerbianShoshoneSierra LeoneanSiouxSlavicSlovakSloveneSomaliSouth AfricanSouth AmericanSouth American IndianSoviet UnionSpaniardSpanishSpanish AmericanSpanish American IndianSri LankanSubsaharan AfricanSudaneseSwedishSwissSyrianTaiwaneseThaiTlingit-HaidaTohono O'OdhamTonganTrinidadian and TobagonianTsimshianTurkishU.S. Virgin IslanderUgandanUkrainianUruguayanUteVenezuelanVietnameseWelshWest IndianYakamaYaquiYugoslavianYumanYup'ikZimbabwean
Immigration
NonimmigrantsImmigrantsAfghanistanAfricaAlbaniaArgentinaArmeniaAsiaAustraliaAustriaBahamasBangladeshBarbadosBelarusBelgiumBelizeBoliviaBosnia and HerzegovinaBrazilBulgariaBurma/MyanmarCabo VerdeCambodiaCameroonCanadaCaribbeanCentral AmericaChileChinaColombiaCongoCosta RicaCroatiaCubaCzechoslovakiaDenmarkDominicaDominican RepublicEastern AfricaEastern AsiaEastern EuropeEcuadorEgyptEl SalvadorEnglandEritreaEthiopiaEuropeFijiFranceGermanyGhanaGreeceGrenadaGuatemalaGuyanaHaitiHondurasHong KongHungaryIndiaIndonesiaIranIraqIrelandIsraelItalyJamaicaJapanJordanKazakhstanKenyaKoreaKuwaitLaosLatin AmericaLatviaLebanonLiberiaLithuaniaMalaysiaMexicoMicronesiaMiddle AfricaMoldovaMoroccoNepalNetherlandsNicaraguaNigeriaNorth AmericaNorth MacedoniaNorthern AfricaNorthern EuropeNorwayOceaniaPakistanPanamaPeruPhilippinesPolandPortugalRomaniaRussiaSaudi ArabiaScotlandSenegalSerbiaSierra LeoneSingaporeSomaliaSouth AfricaSouth AmericaSouth Central AsiaSouth Eastern AsiaSouthern EuropeSpainSri LankaSt. Vincent and the GrenadinesSudanSwedenSwitzerlandSyriaTaiwanThailandTrinidad and TobagoTurkeyUgandaUkraineUruguayUzbekistanVenezuelaVietnamWest IndiesWestern AfricaWestern AsiaWestern EuropeYemenZaireZimbabweAzores
Female Poverty
Income
Poverty
Unemployment
Labor Participation
Family Structure
Vehicle Availability
Education Level
Disability

Female Poverty Comparison

Alaskan Athabascans

Immigrants from Dominica

Tragic
Tragic
14.4%
FEMALE POVERTY
5.3/ 100
METRIC RATING
213th/ 347
METRIC RANK
17.5%
FEMALE POVERTY
0.0/ 100
METRIC RATING
320th/ 347
METRIC RANK

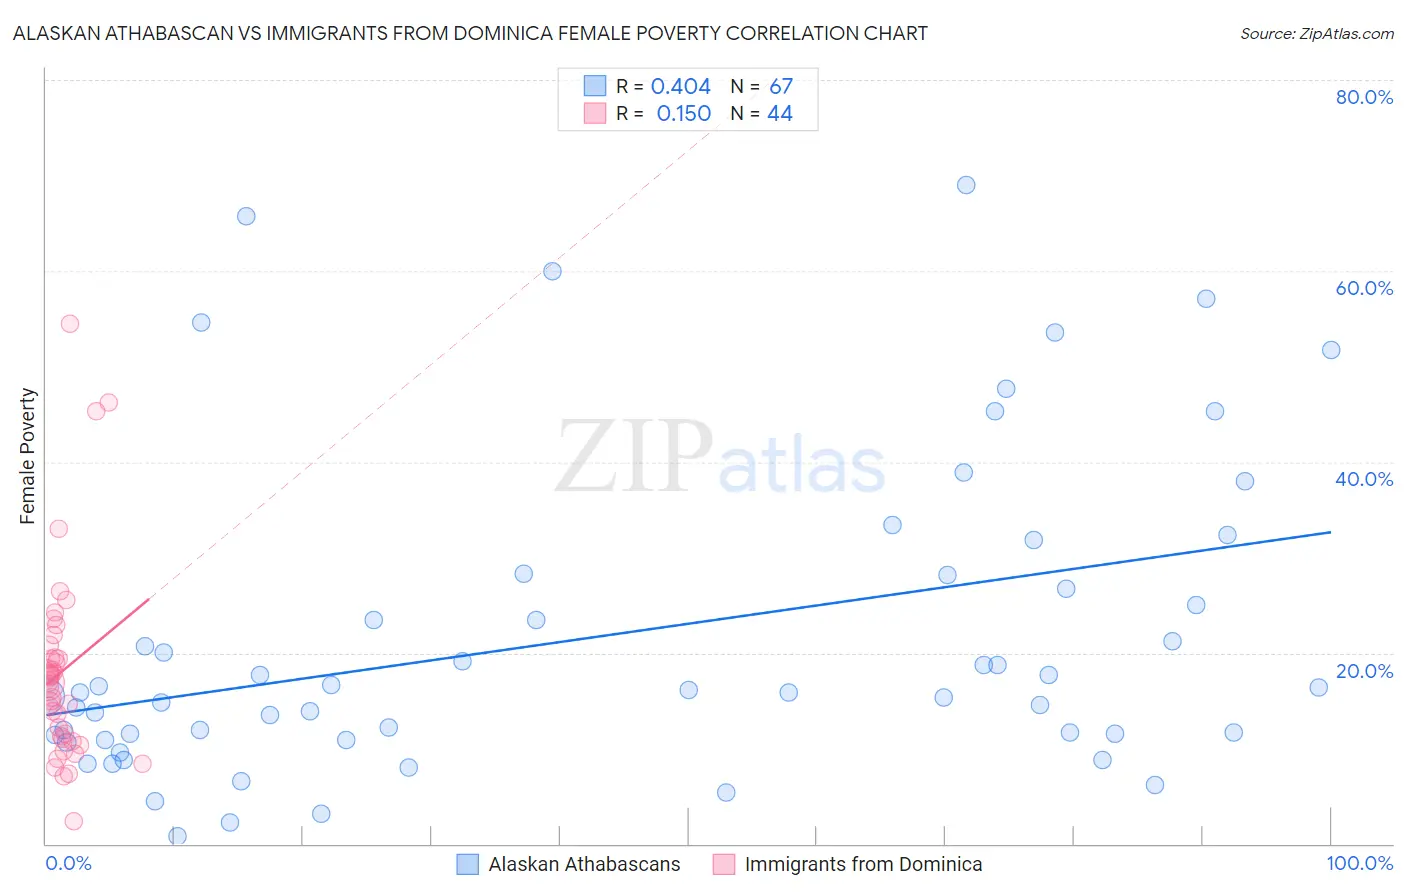
Alaskan Athabascan vs Immigrants from Dominica Female Poverty Correlation Chart

The statistical analysis conducted on geographies consisting of 45,807,044 people shows a moderate positive correlation between the proportion of Alaskan Athabascans and poverty level among females in the United States with a correlation coefficient (R) of 0.404 and weighted average of 14.4%. Similarly, the statistical analysis conducted on geographies consisting of 83,788,429 people shows a poor positive correlation between the proportion of Immigrants from Dominica and poverty level among females in the United States with a correlation coefficient (R) of 0.150 and weighted average of 17.5%, a difference of 21.5%.
Alaskan Athabascan vs Immigrants from Dominica Female Poverty

Female Poverty Correlation Summary

MeasurementAlaskan AthabascanImmigrants from Dominica
Minimum0.78%2.4%
Maximum69.0%54.5%
Range68.2%52.1%
Mean21.7%18.0%
Median15.9%16.9%
Interquartile 25% (IQ1)11.4%11.1%
Interquartile 75% (IQ3)28.2%20.1%
Interquartile Range (IQR)16.9%9.0%
Standard Deviation (Sample)16.4%10.3%
Standard Deviation (Population)16.3%10.2%

Similar Demographics by Female Poverty

Demographics Similar to Alaskan Athabascans by Female Poverty

In terms of female poverty, the demographic groups most similar to Alaskan Athabascans are Bermudan (14.4%, a difference of 0.080%), Marshallese (14.4%, a difference of 0.16%), Immigrants from Panama (14.4%, a difference of 0.30%), Immigrants from Thailand (14.4%, a difference of 0.39%), and Immigrants (14.4%, a difference of 0.42%).
DemographicsRating | RankFemale Poverty
Immigrants | Uruguay
14.0
/100
|
#206
Poor
14.0%
Immigrants | Eastern Africa
9.0
/100
|
#207
Tragic
14.2%
Immigrants | Azores
7.9
/100
|
#208
Tragic
14.2%
Panamanians
7.7
/100
|
#209
Tragic
14.2%
Malaysians
7.4
/100
|
#210
Tragic
14.3%
Moroccans
7.2
/100
|
#211
Tragic
14.3%
Bermudans
5.5
/100
|
#212
Tragic
14.4%
Alaskan Athabascans
5.3
/100
|
#213
Tragic
14.4%
Marshallese
5.0
/100
|
#214
Tragic
14.4%
Immigrants | Panama
4.7
/100
|
#215
Tragic
14.4%
Immigrants | Thailand
4.5
/100
|
#216
Tragic
14.4%
Immigrants | Immigrants
4.5
/100
|
#217
Tragic
14.4%
Immigrants | Uzbekistan
4.4
/100
|
#218
Tragic
14.4%
Japanese
4.1
/100
|
#219
Tragic
14.5%
Alsatians
4.0
/100
|
#220
Tragic
14.5%

Demographics Similar to Immigrants from Dominica by Female Poverty

In terms of female poverty, the demographic groups most similar to Immigrants from Dominica are Arapaho (17.5%, a difference of 0.060%), Cajun (17.5%, a difference of 0.080%), Ute (17.5%, a difference of 0.10%), Immigrants from Congo (17.4%, a difference of 0.42%), and Honduran (17.4%, a difference of 0.61%).
DemographicsRating | RankFemale Poverty
British West Indians
0.0
/100
|
#313
Tragic
17.0%
Dutch West Indians
0.0
/100
|
#314
Tragic
17.1%
U.S. Virgin Islanders
0.0
/100
|
#315
Tragic
17.3%
Hondurans
0.0
/100
|
#316
Tragic
17.4%
Immigrants | Congo
0.0
/100
|
#317
Tragic
17.4%
Ute
0.0
/100
|
#318
Tragic
17.5%
Cajuns
0.0
/100
|
#319
Tragic
17.5%
Immigrants | Dominica
0.0
/100
|
#320
Tragic
17.5%
Arapaho
0.0
/100
|
#321
Tragic
17.5%
Menominee
0.0
/100
|
#322
Tragic
17.6%
Paiute
0.0
/100
|
#323
Tragic
17.7%
Immigrants | Honduras
0.0
/100
|
#324
Tragic
17.7%
Colville
0.0
/100
|
#325
Tragic
17.8%
Central American Indians
0.0
/100
|
#326
Tragic
18.0%
Yakama
0.0
/100
|
#327
Tragic
18.0%