Immigrants from Africa vs Immigrants from Dominica Female Poverty
COMPARE
Immigrants from Africa
Immigrants from Dominica
Female Poverty
Female Poverty Comparison
Immigrants from Africa
Immigrants from Dominica
14.5%
FEMALE POVERTY
3.3/ 100
METRIC RATING
223rd/ 347
METRIC RANK
17.5%
FEMALE POVERTY
0.0/ 100
METRIC RATING
320th/ 347
METRIC RANK
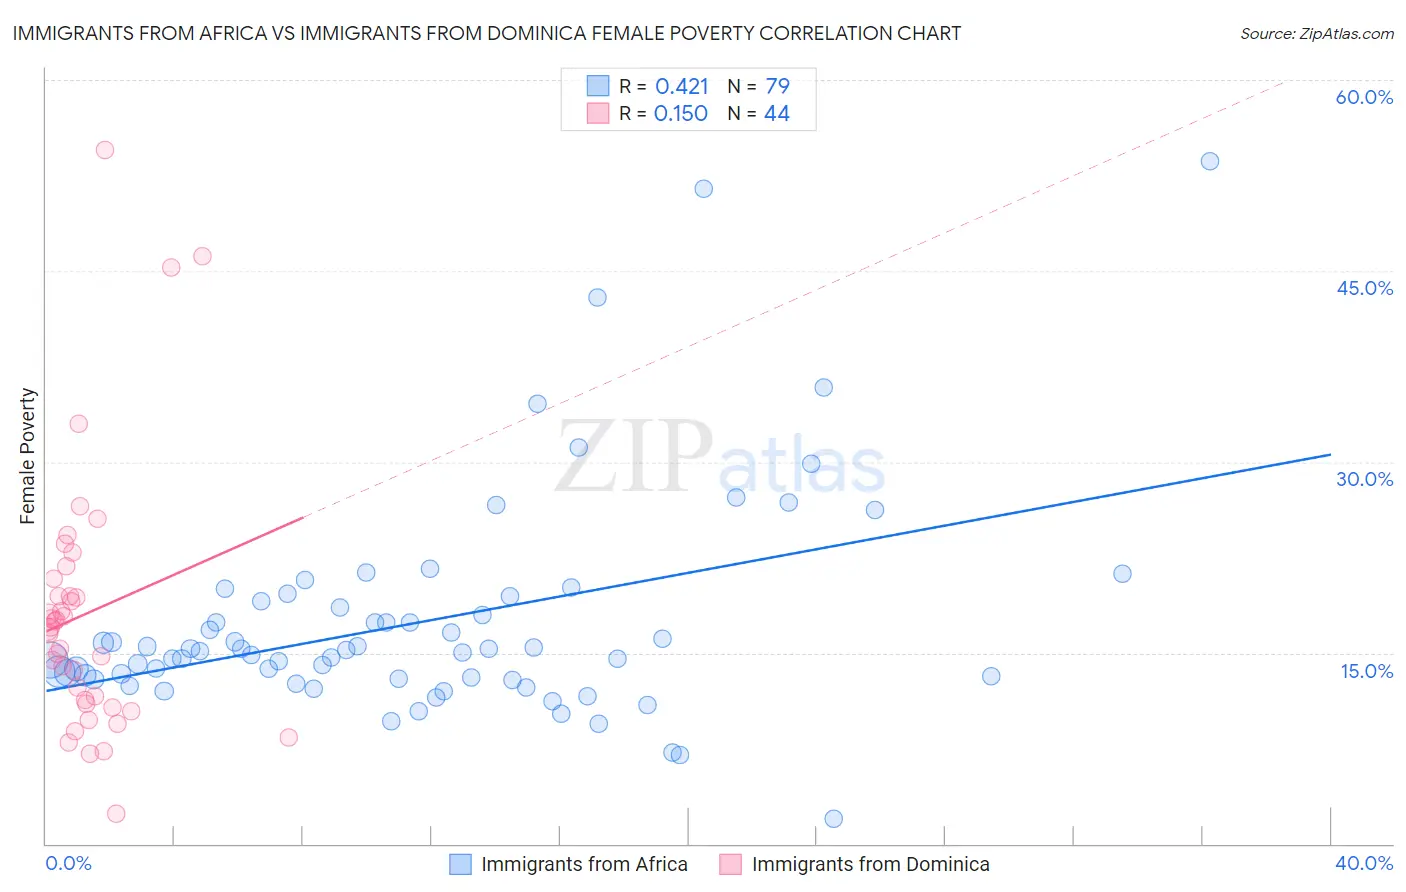
Immigrants from Africa vs Immigrants from Dominica Female Poverty Correlation Chart
The statistical analysis conducted on geographies consisting of 468,810,644 people shows a moderate positive correlation between the proportion of Immigrants from Africa and poverty level among females in the United States with a correlation coefficient (R) of 0.421 and weighted average of 14.5%. Similarly, the statistical analysis conducted on geographies consisting of 83,788,429 people shows a poor positive correlation between the proportion of Immigrants from Dominica and poverty level among females in the United States with a correlation coefficient (R) of 0.150 and weighted average of 17.5%, a difference of 20.2%.
Female Poverty Correlation Summary
| Measurement | Immigrants from Africa | Immigrants from Dominica |
| Minimum | 1.9% | 2.4% |
| Maximum | 53.6% | 54.5% |
| Range | 51.7% | 52.1% |
| Mean | 17.4% | 18.0% |
| Median | 15.1% | 16.9% |
| Interquartile 25% (IQ1) | 12.9% | 11.1% |
| Interquartile 75% (IQ3) | 19.0% | 20.1% |
| Interquartile Range (IQR) | 6.1% | 9.0% |
| Standard Deviation (Sample) | 8.7% | 10.3% |
| Standard Deviation (Population) | 8.6% | 10.2% |
Similar Demographics by Female Poverty
Demographics Similar to Immigrants from Africa by Female Poverty
In terms of female poverty, the demographic groups most similar to Immigrants from Africa are Nonimmigrants (14.5%, a difference of 0.23%), Immigrants from Cambodia (14.5%, a difference of 0.26%), American (14.6%, a difference of 0.39%), Immigrants from Micronesia (14.6%, a difference of 0.40%), and Alsatian (14.5%, a difference of 0.45%).
| Demographics | Rating | Rank | Female Poverty |
| Immigrants | Thailand | 4.5 /100 | #216 | Tragic 14.4% |
| Immigrants | Immigrants | 4.5 /100 | #217 | Tragic 14.4% |
| Immigrants | Uzbekistan | 4.4 /100 | #218 | Tragic 14.4% |
| Japanese | 4.1 /100 | #219 | Tragic 14.5% |
| Alsatians | 4.0 /100 | #220 | Tragic 14.5% |
| Immigrants | Cambodia | 3.7 /100 | #221 | Tragic 14.5% |
| Immigrants | Nonimmigrants | 3.7 /100 | #222 | Tragic 14.5% |
| Immigrants | Africa | 3.3 /100 | #223 | Tragic 14.5% |
| Americans | 2.8 /100 | #224 | Tragic 14.6% |
| Immigrants | Micronesia | 2.8 /100 | #225 | Tragic 14.6% |
| Immigrants | Eritrea | 2.4 /100 | #226 | Tragic 14.6% |
| Immigrants | Nigeria | 2.1 /100 | #227 | Tragic 14.7% |
| German Russians | 2.0 /100 | #228 | Tragic 14.7% |
| Ghanaians | 1.9 /100 | #229 | Tragic 14.7% |
| Alaska Natives | 1.8 /100 | #230 | Tragic 14.7% |
Demographics Similar to Immigrants from Dominica by Female Poverty
In terms of female poverty, the demographic groups most similar to Immigrants from Dominica are Arapaho (17.5%, a difference of 0.060%), Cajun (17.5%, a difference of 0.080%), Ute (17.5%, a difference of 0.10%), Immigrants from Congo (17.4%, a difference of 0.42%), and Honduran (17.4%, a difference of 0.61%).
| Demographics | Rating | Rank | Female Poverty |
| British West Indians | 0.0 /100 | #313 | Tragic 17.0% |
| Dutch West Indians | 0.0 /100 | #314 | Tragic 17.1% |
| U.S. Virgin Islanders | 0.0 /100 | #315 | Tragic 17.3% |
| Hondurans | 0.0 /100 | #316 | Tragic 17.4% |
| Immigrants | Congo | 0.0 /100 | #317 | Tragic 17.4% |
| Ute | 0.0 /100 | #318 | Tragic 17.5% |
| Cajuns | 0.0 /100 | #319 | Tragic 17.5% |
| Immigrants | Dominica | 0.0 /100 | #320 | Tragic 17.5% |
| Arapaho | 0.0 /100 | #321 | Tragic 17.5% |
| Menominee | 0.0 /100 | #322 | Tragic 17.6% |
| Paiute | 0.0 /100 | #323 | Tragic 17.7% |
| Immigrants | Honduras | 0.0 /100 | #324 | Tragic 17.7% |
| Colville | 0.0 /100 | #325 | Tragic 17.8% |
| Central American Indians | 0.0 /100 | #326 | Tragic 18.0% |
| Yakama | 0.0 /100 | #327 | Tragic 18.0% |