Tsimshian vs Immigrants from Lithuania Female Poverty
COMPARE
Tsimshian
Immigrants from Lithuania
Female Poverty
Female Poverty Comparison
Tsimshian
Immigrants from Lithuania
13.1%
FEMALE POVERTY
75.5/ 100
METRIC RATING
150th/ 347
METRIC RANK
11.3%
FEMALE POVERTY
99.9/ 100
METRIC RATING
13th/ 347
METRIC RANK
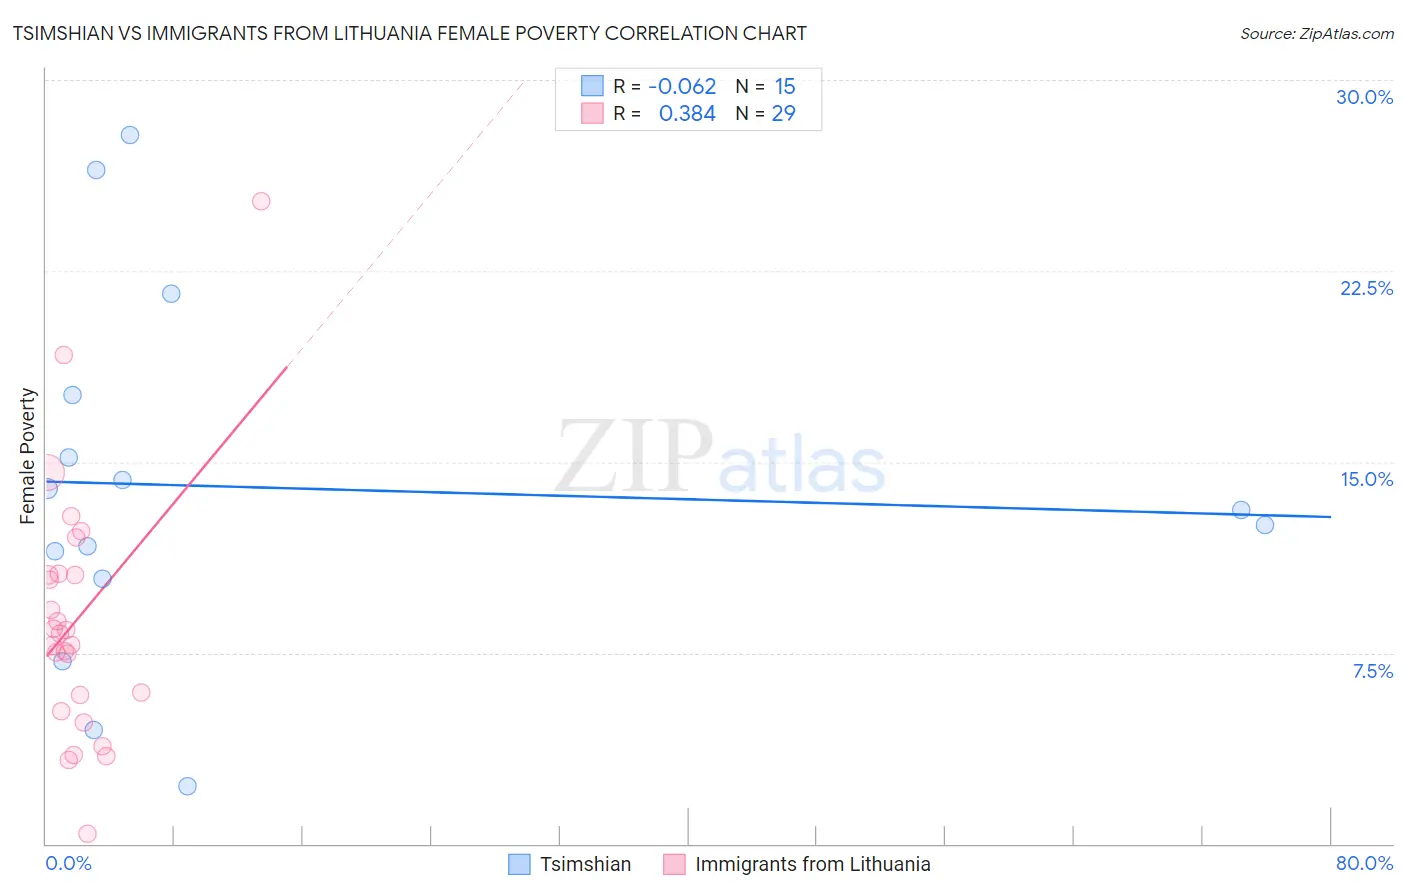
Tsimshian vs Immigrants from Lithuania Female Poverty Correlation Chart
The statistical analysis conducted on geographies consisting of 15,626,462 people shows a slight negative correlation between the proportion of Tsimshian and poverty level among females in the United States with a correlation coefficient (R) of -0.062 and weighted average of 13.1%. Similarly, the statistical analysis conducted on geographies consisting of 117,711,686 people shows a mild positive correlation between the proportion of Immigrants from Lithuania and poverty level among females in the United States with a correlation coefficient (R) of 0.384 and weighted average of 11.3%, a difference of 15.9%.
Female Poverty Correlation Summary
| Measurement | Tsimshian | Immigrants from Lithuania |
| Minimum | 2.2% | 0.39% |
| Maximum | 27.8% | 25.2% |
| Range | 25.6% | 24.8% |
| Mean | 14.0% | 8.8% |
| Median | 13.1% | 8.3% |
| Interquartile 25% (IQ1) | 10.4% | 5.5% |
| Interquartile 75% (IQ3) | 17.6% | 10.6% |
| Interquartile Range (IQR) | 7.2% | 5.1% |
| Standard Deviation (Sample) | 7.2% | 5.0% |
| Standard Deviation (Population) | 6.9% | 4.9% |
Similar Demographics by Female Poverty
Demographics Similar to Tsimshian by Female Poverty
In terms of female poverty, the demographic groups most similar to Tsimshian are Taiwanese (13.1%, a difference of 0.030%), Immigrants from Germany (13.1%, a difference of 0.070%), Yugoslavian (13.1%, a difference of 0.19%), Samoan (13.1%, a difference of 0.24%), and Immigrants from Kazakhstan (13.0%, a difference of 0.44%).
| Demographics | Rating | Rank | Female Poverty |
| Immigrants | Malaysia | 80.4 /100 | #143 | Excellent 13.0% |
| Afghans | 79.8 /100 | #144 | Good 13.0% |
| Syrians | 79.6 /100 | #145 | Good 13.0% |
| Immigrants | Peru | 79.1 /100 | #146 | Good 13.0% |
| Immigrants | Kazakhstan | 78.6 /100 | #147 | Good 13.0% |
| Yugoslavians | 76.9 /100 | #148 | Good 13.1% |
| Taiwanese | 75.7 /100 | #149 | Good 13.1% |
| Tsimshian | 75.5 /100 | #150 | Good 13.1% |
| Immigrants | Germany | 74.9 /100 | #151 | Good 13.1% |
| Samoans | 73.6 /100 | #152 | Good 13.1% |
| Immigrants | Fiji | 71.0 /100 | #153 | Good 13.2% |
| Armenians | 70.4 /100 | #154 | Good 13.2% |
| Hungarians | 70.1 /100 | #155 | Good 13.2% |
| Immigrants | Bosnia and Herzegovina | 69.7 /100 | #156 | Good 13.2% |
| Immigrants | Northern Africa | 68.8 /100 | #157 | Good 13.2% |
Demographics Similar to Immigrants from Lithuania by Female Poverty
In terms of female poverty, the demographic groups most similar to Immigrants from Lithuania are Bhutanese (11.3%, a difference of 0.010%), Maltese (11.2%, a difference of 0.47%), Immigrants from Hong Kong (11.2%, a difference of 0.58%), Lithuanian (11.4%, a difference of 0.96%), and Latvian (11.4%, a difference of 1.3%).
| Demographics | Rating | Rank | Female Poverty |
| Immigrants | Ireland | 99.9 /100 | #6 | Exceptional 11.0% |
| Assyrians/Chaldeans/Syriacs | 99.9 /100 | #7 | Exceptional 11.0% |
| Immigrants | South Central Asia | 99.9 /100 | #8 | Exceptional 11.1% |
| Bulgarians | 99.9 /100 | #9 | Exceptional 11.1% |
| Immigrants | Hong Kong | 99.9 /100 | #10 | Exceptional 11.2% |
| Maltese | 99.9 /100 | #11 | Exceptional 11.2% |
| Bhutanese | 99.9 /100 | #12 | Exceptional 11.3% |
| Immigrants | Lithuania | 99.9 /100 | #13 | Exceptional 11.3% |
| Lithuanians | 99.8 /100 | #14 | Exceptional 11.4% |
| Latvians | 99.8 /100 | #15 | Exceptional 11.4% |
| Immigrants | Bolivia | 99.8 /100 | #16 | Exceptional 11.5% |
| Bolivians | 99.8 /100 | #17 | Exceptional 11.5% |
| Immigrants | Scotland | 99.8 /100 | #18 | Exceptional 11.5% |
| Norwegians | 99.8 /100 | #19 | Exceptional 11.5% |
| Eastern Europeans | 99.7 /100 | #20 | Exceptional 11.5% |