Immigrants from Switzerland vs Immigrants from Dominica Female Poverty
COMPARE
Immigrants from Switzerland
Immigrants from Dominica
Female Poverty
Female Poverty Comparison
Immigrants from Switzerland
Immigrants from Dominica
12.9%
FEMALE POVERTY
85.8/ 100
METRIC RATING
134th/ 347
METRIC RANK
17.5%
FEMALE POVERTY
0.0/ 100
METRIC RATING
320th/ 347
METRIC RANK
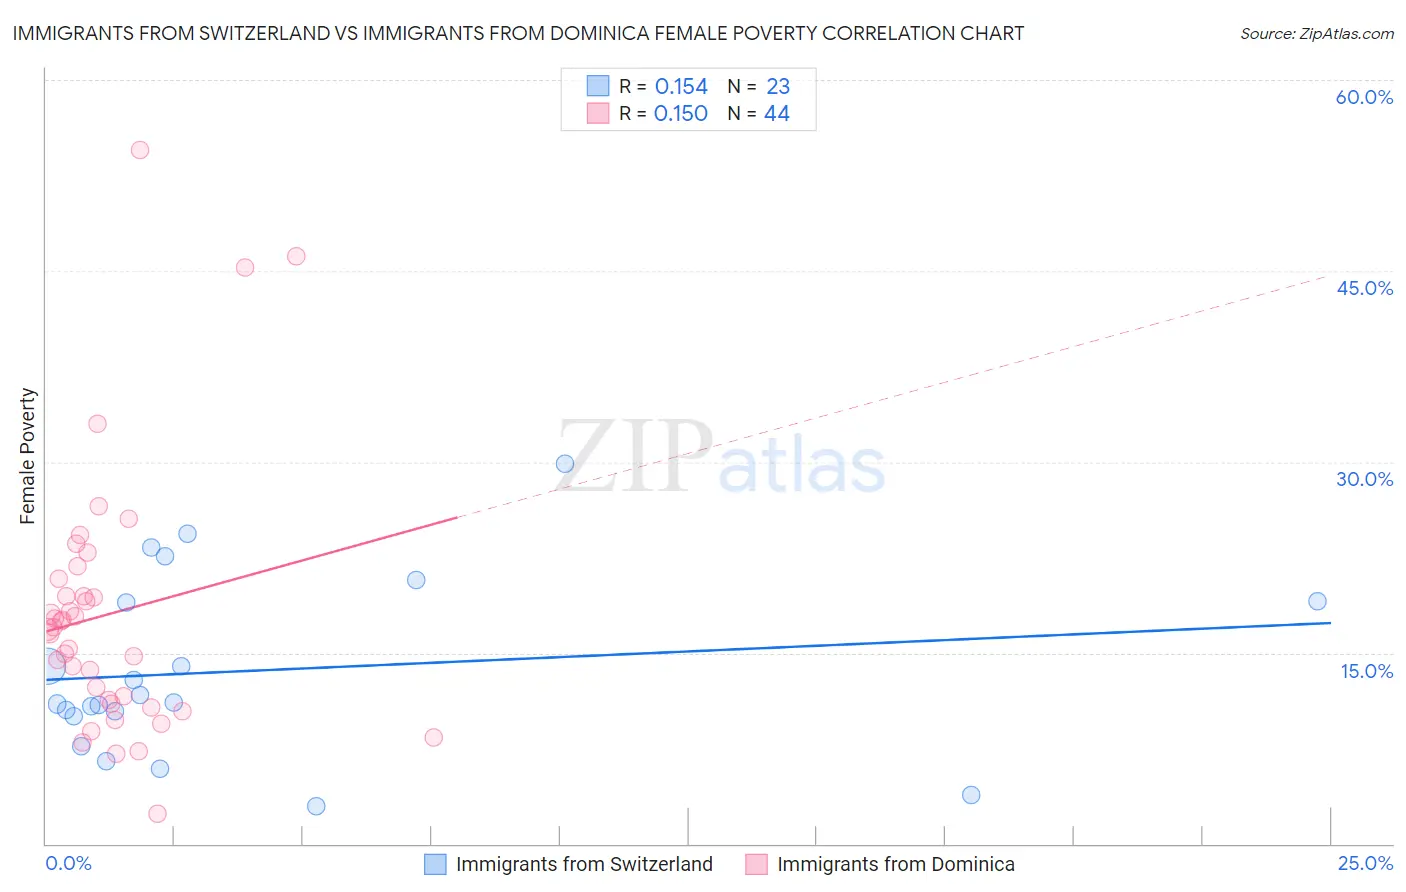
Immigrants from Switzerland vs Immigrants from Dominica Female Poverty Correlation Chart
The statistical analysis conducted on geographies consisting of 148,048,454 people shows a poor positive correlation between the proportion of Immigrants from Switzerland and poverty level among females in the United States with a correlation coefficient (R) of 0.154 and weighted average of 12.9%. Similarly, the statistical analysis conducted on geographies consisting of 83,788,429 people shows a poor positive correlation between the proportion of Immigrants from Dominica and poverty level among females in the United States with a correlation coefficient (R) of 0.150 and weighted average of 17.5%, a difference of 35.9%.
Female Poverty Correlation Summary
| Measurement | Immigrants from Switzerland | Immigrants from Dominica |
| Minimum | 2.9% | 2.4% |
| Maximum | 29.9% | 54.5% |
| Range | 27.0% | 52.1% |
| Mean | 13.6% | 18.0% |
| Median | 11.1% | 16.9% |
| Interquartile 25% (IQ1) | 10.0% | 11.1% |
| Interquartile 75% (IQ3) | 19.0% | 20.1% |
| Interquartile Range (IQR) | 9.0% | 9.0% |
| Standard Deviation (Sample) | 7.0% | 10.3% |
| Standard Deviation (Population) | 6.9% | 10.2% |
Similar Demographics by Female Poverty
Demographics Similar to Immigrants from Switzerland by Female Poverty
In terms of female poverty, the demographic groups most similar to Immigrants from Switzerland are French (12.9%, a difference of 0.050%), Peruvian (12.9%, a difference of 0.13%), Immigrants from Western Europe (12.8%, a difference of 0.16%), Immigrants from Jordan (12.8%, a difference of 0.22%), and Chilean (12.9%, a difference of 0.22%).
| Demographics | Rating | Rank | Female Poverty |
| South Africans | 88.4 /100 | #127 | Excellent 12.8% |
| Immigrants | Belarus | 88.2 /100 | #128 | Excellent 12.8% |
| Immigrants | Brazil | 87.9 /100 | #129 | Excellent 12.8% |
| Immigrants | Vietnam | 87.1 /100 | #130 | Excellent 12.8% |
| Immigrants | Argentina | 87.0 /100 | #131 | Excellent 12.8% |
| Immigrants | Jordan | 86.9 /100 | #132 | Excellent 12.8% |
| Immigrants | Western Europe | 86.6 /100 | #133 | Excellent 12.8% |
| Immigrants | Switzerland | 85.8 /100 | #134 | Excellent 12.9% |
| French | 85.6 /100 | #135 | Excellent 12.9% |
| Peruvians | 85.2 /100 | #136 | Excellent 12.9% |
| Chileans | 84.7 /100 | #137 | Excellent 12.9% |
| Immigrants | France | 83.6 /100 | #138 | Excellent 12.9% |
| Basques | 83.1 /100 | #139 | Excellent 12.9% |
| Pakistanis | 83.0 /100 | #140 | Excellent 12.9% |
| Icelanders | 81.1 /100 | #141 | Excellent 13.0% |
Demographics Similar to Immigrants from Dominica by Female Poverty
In terms of female poverty, the demographic groups most similar to Immigrants from Dominica are Arapaho (17.5%, a difference of 0.060%), Cajun (17.5%, a difference of 0.080%), Ute (17.5%, a difference of 0.10%), Immigrants from Congo (17.4%, a difference of 0.42%), and Honduran (17.4%, a difference of 0.61%).
| Demographics | Rating | Rank | Female Poverty |
| British West Indians | 0.0 /100 | #313 | Tragic 17.0% |
| Dutch West Indians | 0.0 /100 | #314 | Tragic 17.1% |
| U.S. Virgin Islanders | 0.0 /100 | #315 | Tragic 17.3% |
| Hondurans | 0.0 /100 | #316 | Tragic 17.4% |
| Immigrants | Congo | 0.0 /100 | #317 | Tragic 17.4% |
| Ute | 0.0 /100 | #318 | Tragic 17.5% |
| Cajuns | 0.0 /100 | #319 | Tragic 17.5% |
| Immigrants | Dominica | 0.0 /100 | #320 | Tragic 17.5% |
| Arapaho | 0.0 /100 | #321 | Tragic 17.5% |
| Menominee | 0.0 /100 | #322 | Tragic 17.6% |
| Paiute | 0.0 /100 | #323 | Tragic 17.7% |
| Immigrants | Honduras | 0.0 /100 | #324 | Tragic 17.7% |
| Colville | 0.0 /100 | #325 | Tragic 17.8% |
| Central American Indians | 0.0 /100 | #326 | Tragic 18.0% |
| Yakama | 0.0 /100 | #327 | Tragic 18.0% |