Tsimshian vs Immigrants from Caribbean Female Poverty
COMPARE
Tsimshian
Immigrants from Caribbean
Female Poverty
Female Poverty Comparison
Tsimshian
Immigrants from Caribbean
13.1%
FEMALE POVERTY
75.5/ 100
METRIC RATING
150th/ 347
METRIC RANK
16.9%
FEMALE POVERTY
0.0/ 100
METRIC RATING
306th/ 347
METRIC RANK
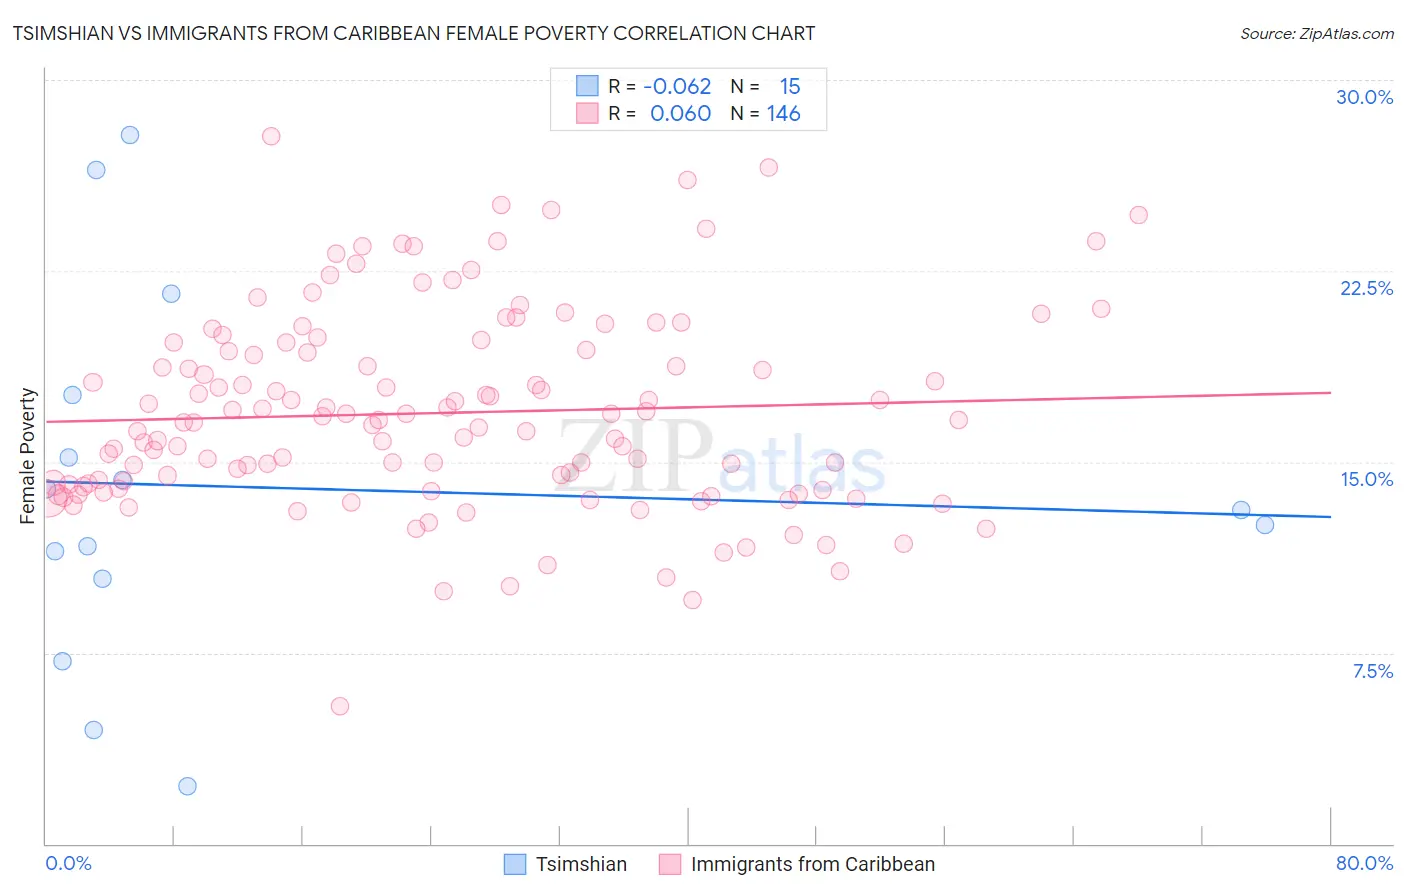
Tsimshian vs Immigrants from Caribbean Female Poverty Correlation Chart
The statistical analysis conducted on geographies consisting of 15,626,462 people shows a slight negative correlation between the proportion of Tsimshian and poverty level among females in the United States with a correlation coefficient (R) of -0.062 and weighted average of 13.1%. Similarly, the statistical analysis conducted on geographies consisting of 449,490,616 people shows a slight positive correlation between the proportion of Immigrants from Caribbean and poverty level among females in the United States with a correlation coefficient (R) of 0.060 and weighted average of 16.9%, a difference of 29.0%.
Female Poverty Correlation Summary
| Measurement | Tsimshian | Immigrants from Caribbean |
| Minimum | 2.2% | 5.4% |
| Maximum | 27.8% | 27.8% |
| Range | 25.6% | 22.4% |
| Mean | 14.0% | 16.9% |
| Median | 13.1% | 16.6% |
| Interquartile 25% (IQ1) | 10.4% | 14.0% |
| Interquartile 75% (IQ3) | 17.6% | 19.4% |
| Interquartile Range (IQR) | 7.2% | 5.3% |
| Standard Deviation (Sample) | 7.2% | 3.9% |
| Standard Deviation (Population) | 6.9% | 3.9% |
Similar Demographics by Female Poverty
Demographics Similar to Tsimshian by Female Poverty
In terms of female poverty, the demographic groups most similar to Tsimshian are Taiwanese (13.1%, a difference of 0.030%), Immigrants from Germany (13.1%, a difference of 0.070%), Yugoslavian (13.1%, a difference of 0.19%), Samoan (13.1%, a difference of 0.24%), and Immigrants from Kazakhstan (13.0%, a difference of 0.44%).
| Demographics | Rating | Rank | Female Poverty |
| Immigrants | Malaysia | 80.4 /100 | #143 | Excellent 13.0% |
| Afghans | 79.8 /100 | #144 | Good 13.0% |
| Syrians | 79.6 /100 | #145 | Good 13.0% |
| Immigrants | Peru | 79.1 /100 | #146 | Good 13.0% |
| Immigrants | Kazakhstan | 78.6 /100 | #147 | Good 13.0% |
| Yugoslavians | 76.9 /100 | #148 | Good 13.1% |
| Taiwanese | 75.7 /100 | #149 | Good 13.1% |
| Tsimshian | 75.5 /100 | #150 | Good 13.1% |
| Immigrants | Germany | 74.9 /100 | #151 | Good 13.1% |
| Samoans | 73.6 /100 | #152 | Good 13.1% |
| Immigrants | Fiji | 71.0 /100 | #153 | Good 13.2% |
| Armenians | 70.4 /100 | #154 | Good 13.2% |
| Hungarians | 70.1 /100 | #155 | Good 13.2% |
| Immigrants | Bosnia and Herzegovina | 69.7 /100 | #156 | Good 13.2% |
| Immigrants | Northern Africa | 68.8 /100 | #157 | Good 13.2% |
Demographics Similar to Immigrants from Caribbean by Female Poverty
In terms of female poverty, the demographic groups most similar to Immigrants from Caribbean are Seminole (16.9%, a difference of 0.12%), African (16.9%, a difference of 0.19%), Immigrants from Central America (16.8%, a difference of 0.27%), Immigrants from Grenada (16.8%, a difference of 0.27%), and Choctaw (16.8%, a difference of 0.33%).
| Demographics | Rating | Rank | Female Poverty |
| Hispanics or Latinos | 0.0 /100 | #299 | Tragic 16.6% |
| Bahamians | 0.0 /100 | #300 | Tragic 16.6% |
| Guatemalans | 0.0 /100 | #301 | Tragic 16.7% |
| Chippewa | 0.0 /100 | #302 | Tragic 16.7% |
| Choctaw | 0.0 /100 | #303 | Tragic 16.8% |
| Immigrants | Central America | 0.0 /100 | #304 | Tragic 16.8% |
| Immigrants | Grenada | 0.0 /100 | #305 | Tragic 16.8% |
| Immigrants | Caribbean | 0.0 /100 | #306 | Tragic 16.9% |
| Seminole | 0.0 /100 | #307 | Tragic 16.9% |
| Africans | 0.0 /100 | #308 | Tragic 16.9% |
| Immigrants | Mexico | 0.0 /100 | #309 | Tragic 17.0% |
| Creek | 0.0 /100 | #310 | Tragic 17.0% |
| Immigrants | Guatemala | 0.0 /100 | #311 | Tragic 17.0% |
| Immigrants | Somalia | 0.0 /100 | #312 | Tragic 17.0% |
| British West Indians | 0.0 /100 | #313 | Tragic 17.0% |