Yaqui vs Immigrants from Dominica Female Poverty
COMPARE
Yaqui
Immigrants from Dominica
Female Poverty
Female Poverty Comparison
Yaqui
Immigrants from Dominica
16.4%
FEMALE POVERTY
0.0/ 100
METRIC RATING
291st/ 347
METRIC RANK
17.5%
FEMALE POVERTY
0.0/ 100
METRIC RATING
320th/ 347
METRIC RANK
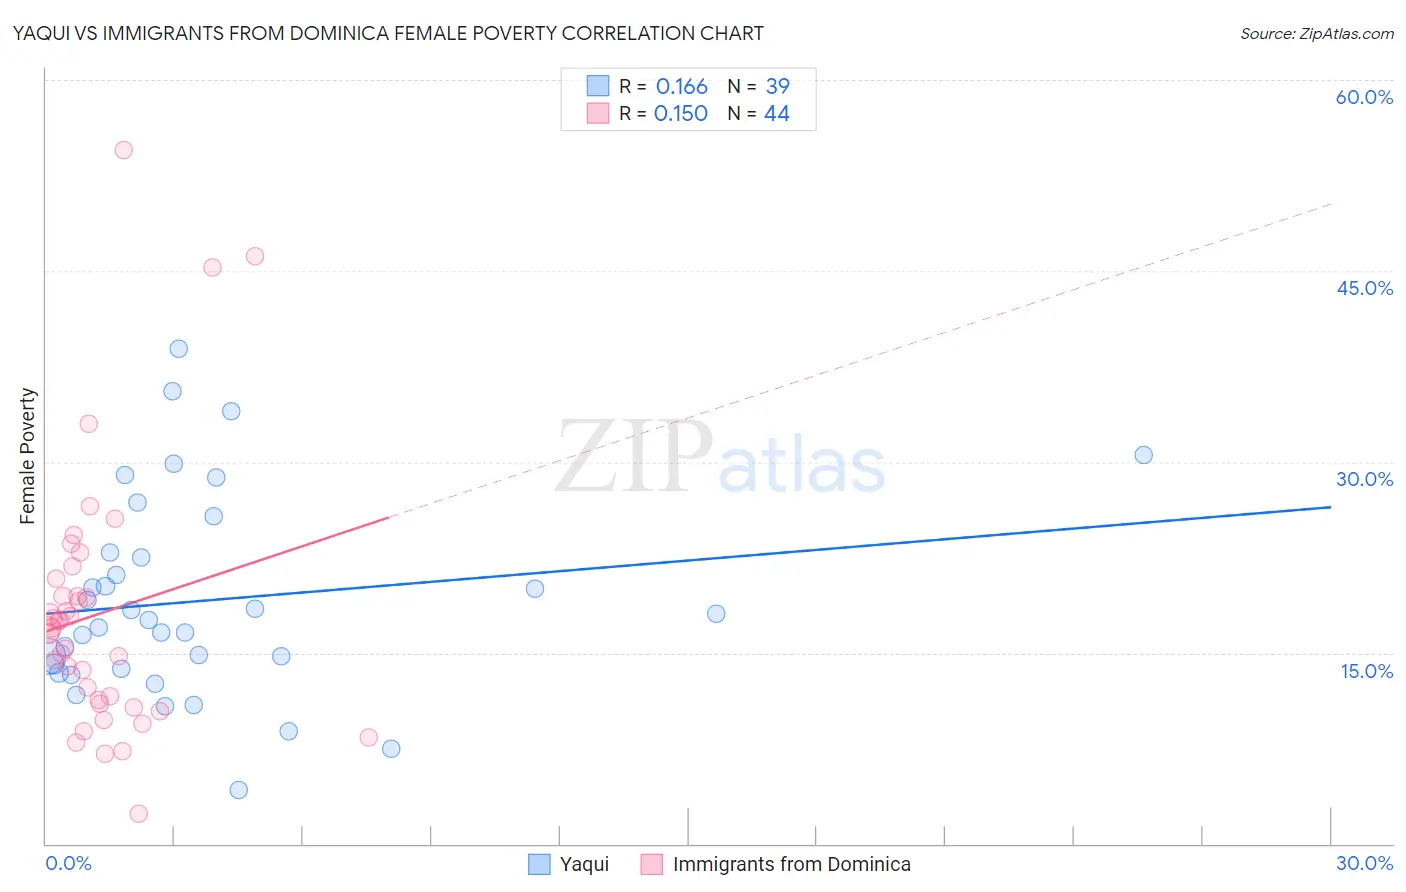
Yaqui vs Immigrants from Dominica Female Poverty Correlation Chart
The statistical analysis conducted on geographies consisting of 107,715,533 people shows a poor positive correlation between the proportion of Yaqui and poverty level among females in the United States with a correlation coefficient (R) of 0.166 and weighted average of 16.4%. Similarly, the statistical analysis conducted on geographies consisting of 83,788,429 people shows a poor positive correlation between the proportion of Immigrants from Dominica and poverty level among females in the United States with a correlation coefficient (R) of 0.150 and weighted average of 17.5%, a difference of 6.4%.
Female Poverty Correlation Summary
| Measurement | Yaqui | Immigrants from Dominica |
| Minimum | 4.2% | 2.4% |
| Maximum | 38.9% | 54.5% |
| Range | 34.7% | 52.1% |
| Mean | 19.1% | 18.0% |
| Median | 17.6% | 16.9% |
| Interquartile 25% (IQ1) | 13.7% | 11.1% |
| Interquartile 75% (IQ3) | 22.9% | 20.1% |
| Interquartile Range (IQR) | 9.1% | 9.0% |
| Standard Deviation (Sample) | 7.9% | 10.3% |
| Standard Deviation (Population) | 7.8% | 10.2% |
Similar Demographics by Female Poverty
Demographics Similar to Yaqui by Female Poverty
In terms of female poverty, the demographic groups most similar to Yaqui are Immigrants from Zaire (16.4%, a difference of 0.010%), Immigrants from Latin America (16.4%, a difference of 0.070%), Immigrants from Cabo Verde (16.4%, a difference of 0.10%), Immigrants from Bangladesh (16.4%, a difference of 0.17%), and Senegalese (16.5%, a difference of 0.18%).
| Demographics | Rating | Rank | Female Poverty |
| Spanish Americans | 0.0 /100 | #284 | Tragic 16.2% |
| Comanche | 0.0 /100 | #285 | Tragic 16.2% |
| Inupiat | 0.0 /100 | #286 | Tragic 16.2% |
| Immigrants | Belize | 0.0 /100 | #287 | Tragic 16.3% |
| Indonesians | 0.0 /100 | #288 | Tragic 16.4% |
| Blackfeet | 0.0 /100 | #289 | Tragic 16.4% |
| Immigrants | Bangladesh | 0.0 /100 | #290 | Tragic 16.4% |
| Yaqui | 0.0 /100 | #291 | Tragic 16.4% |
| Immigrants | Zaire | 0.0 /100 | #292 | Tragic 16.4% |
| Immigrants | Latin America | 0.0 /100 | #293 | Tragic 16.4% |
| Immigrants | Cabo Verde | 0.0 /100 | #294 | Tragic 16.4% |
| Senegalese | 0.0 /100 | #295 | Tragic 16.5% |
| Immigrants | Senegal | 0.0 /100 | #296 | Tragic 16.5% |
| Mexicans | 0.0 /100 | #297 | Tragic 16.5% |
| Somalis | 0.0 /100 | #298 | Tragic 16.6% |
Demographics Similar to Immigrants from Dominica by Female Poverty
In terms of female poverty, the demographic groups most similar to Immigrants from Dominica are Arapaho (17.5%, a difference of 0.060%), Cajun (17.5%, a difference of 0.080%), Ute (17.5%, a difference of 0.10%), Immigrants from Congo (17.4%, a difference of 0.42%), and Honduran (17.4%, a difference of 0.61%).
| Demographics | Rating | Rank | Female Poverty |
| British West Indians | 0.0 /100 | #313 | Tragic 17.0% |
| Dutch West Indians | 0.0 /100 | #314 | Tragic 17.1% |
| U.S. Virgin Islanders | 0.0 /100 | #315 | Tragic 17.3% |
| Hondurans | 0.0 /100 | #316 | Tragic 17.4% |
| Immigrants | Congo | 0.0 /100 | #317 | Tragic 17.4% |
| Ute | 0.0 /100 | #318 | Tragic 17.5% |
| Cajuns | 0.0 /100 | #319 | Tragic 17.5% |
| Immigrants | Dominica | 0.0 /100 | #320 | Tragic 17.5% |
| Arapaho | 0.0 /100 | #321 | Tragic 17.5% |
| Menominee | 0.0 /100 | #322 | Tragic 17.6% |
| Paiute | 0.0 /100 | #323 | Tragic 17.7% |
| Immigrants | Honduras | 0.0 /100 | #324 | Tragic 17.7% |
| Colville | 0.0 /100 | #325 | Tragic 17.8% |
| Central American Indians | 0.0 /100 | #326 | Tragic 18.0% |
| Yakama | 0.0 /100 | #327 | Tragic 18.0% |