Immigrants from Bahamas vs Immigrants from Dominica Female Poverty
COMPARE
Immigrants from Bahamas
Immigrants from Dominica
Female Poverty
Female Poverty Comparison
Immigrants from Bahamas
Immigrants from Dominica
16.1%
FEMALE POVERTY
0.0/ 100
METRIC RATING
279th/ 347
METRIC RANK
17.5%
FEMALE POVERTY
0.0/ 100
METRIC RATING
320th/ 347
METRIC RANK
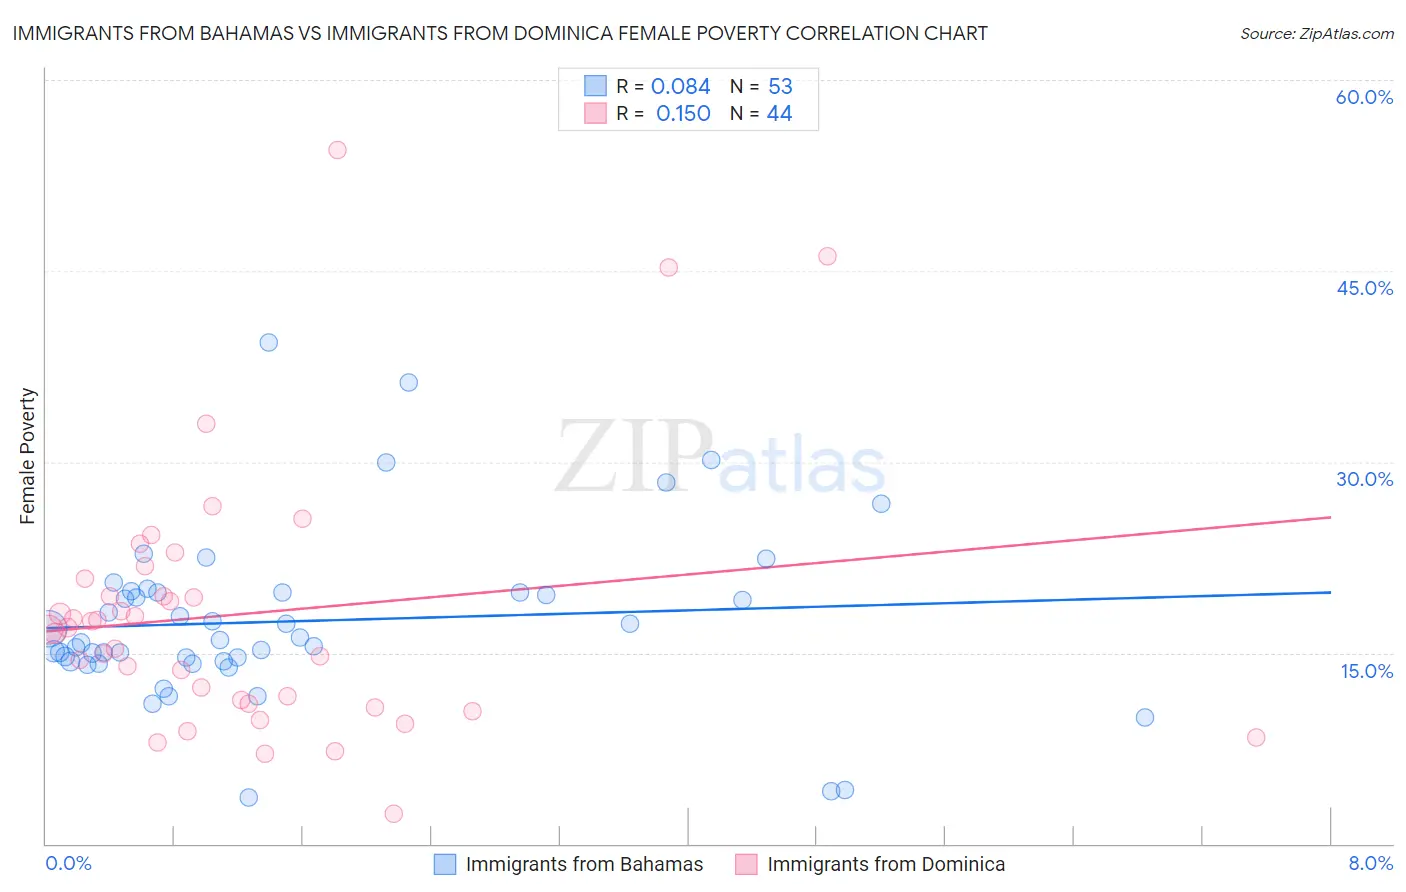
Immigrants from Bahamas vs Immigrants from Dominica Female Poverty Correlation Chart
The statistical analysis conducted on geographies consisting of 104,605,923 people shows a slight positive correlation between the proportion of Immigrants from Bahamas and poverty level among females in the United States with a correlation coefficient (R) of 0.084 and weighted average of 16.1%. Similarly, the statistical analysis conducted on geographies consisting of 83,788,429 people shows a poor positive correlation between the proportion of Immigrants from Dominica and poverty level among females in the United States with a correlation coefficient (R) of 0.150 and weighted average of 17.5%, a difference of 8.7%.
Female Poverty Correlation Summary
| Measurement | Immigrants from Bahamas | Immigrants from Dominica |
| Minimum | 3.7% | 2.4% |
| Maximum | 39.4% | 54.5% |
| Range | 35.8% | 52.1% |
| Mean | 17.5% | 18.0% |
| Median | 16.0% | 16.9% |
| Interquartile 25% (IQ1) | 14.3% | 11.1% |
| Interquartile 75% (IQ3) | 19.8% | 20.1% |
| Interquartile Range (IQR) | 5.4% | 9.0% |
| Standard Deviation (Sample) | 6.7% | 10.3% |
| Standard Deviation (Population) | 6.7% | 10.2% |
Similar Demographics by Female Poverty
Demographics Similar to Immigrants from Bahamas by Female Poverty
In terms of female poverty, the demographic groups most similar to Immigrants from Bahamas are Immigrants from West Indies (16.1%, a difference of 0.12%), Vietnamese (16.1%, a difference of 0.24%), West Indian (16.1%, a difference of 0.26%), Immigrants from Haiti (16.1%, a difference of 0.41%), and Bangladeshi (16.0%, a difference of 0.42%).
| Demographics | Rating | Rank | Female Poverty |
| Belizeans | 0.0 /100 | #272 | Tragic 15.9% |
| Haitians | 0.0 /100 | #273 | Tragic 15.9% |
| Barbadians | 0.0 /100 | #274 | Tragic 15.9% |
| Immigrants | Barbados | 0.0 /100 | #275 | Tragic 16.0% |
| Central Americans | 0.0 /100 | #276 | Tragic 16.0% |
| Bangladeshis | 0.0 /100 | #277 | Tragic 16.0% |
| Immigrants | West Indies | 0.0 /100 | #278 | Tragic 16.1% |
| Immigrants | Bahamas | 0.0 /100 | #279 | Tragic 16.1% |
| Vietnamese | 0.0 /100 | #280 | Tragic 16.1% |
| West Indians | 0.0 /100 | #281 | Tragic 16.1% |
| Immigrants | Haiti | 0.0 /100 | #282 | Tragic 16.1% |
| Immigrants | Cuba | 0.0 /100 | #283 | Tragic 16.1% |
| Spanish Americans | 0.0 /100 | #284 | Tragic 16.2% |
| Comanche | 0.0 /100 | #285 | Tragic 16.2% |
| Inupiat | 0.0 /100 | #286 | Tragic 16.2% |
Demographics Similar to Immigrants from Dominica by Female Poverty
In terms of female poverty, the demographic groups most similar to Immigrants from Dominica are Arapaho (17.5%, a difference of 0.060%), Cajun (17.5%, a difference of 0.080%), Ute (17.5%, a difference of 0.10%), Immigrants from Congo (17.4%, a difference of 0.42%), and Honduran (17.4%, a difference of 0.61%).
| Demographics | Rating | Rank | Female Poverty |
| British West Indians | 0.0 /100 | #313 | Tragic 17.0% |
| Dutch West Indians | 0.0 /100 | #314 | Tragic 17.1% |
| U.S. Virgin Islanders | 0.0 /100 | #315 | Tragic 17.3% |
| Hondurans | 0.0 /100 | #316 | Tragic 17.4% |
| Immigrants | Congo | 0.0 /100 | #317 | Tragic 17.4% |
| Ute | 0.0 /100 | #318 | Tragic 17.5% |
| Cajuns | 0.0 /100 | #319 | Tragic 17.5% |
| Immigrants | Dominica | 0.0 /100 | #320 | Tragic 17.5% |
| Arapaho | 0.0 /100 | #321 | Tragic 17.5% |
| Menominee | 0.0 /100 | #322 | Tragic 17.6% |
| Paiute | 0.0 /100 | #323 | Tragic 17.7% |
| Immigrants | Honduras | 0.0 /100 | #324 | Tragic 17.7% |
| Colville | 0.0 /100 | #325 | Tragic 17.8% |
| Central American Indians | 0.0 /100 | #326 | Tragic 18.0% |
| Yakama | 0.0 /100 | #327 | Tragic 18.0% |