Tsimshian vs Immigrants from Netherlands Female Poverty
COMPARE
Tsimshian
Immigrants from Netherlands
Female Poverty
Female Poverty Comparison
Tsimshian
Immigrants from Netherlands
13.1%
FEMALE POVERTY
75.5/ 100
METRIC RATING
150th/ 347
METRIC RANK
12.2%
FEMALE POVERTY
97.8/ 100
METRIC RATING
68th/ 347
METRIC RANK
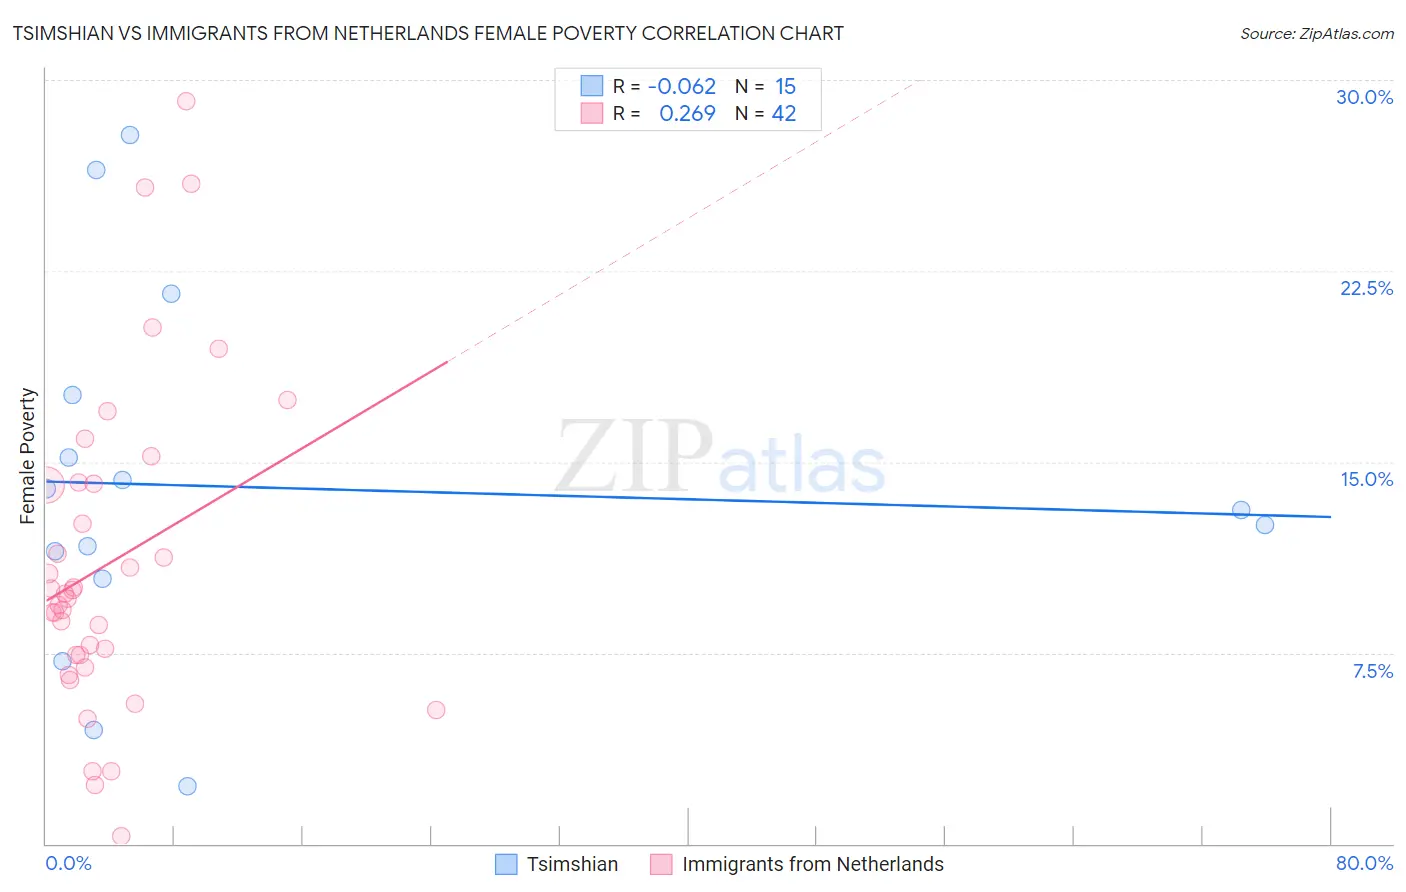
Tsimshian vs Immigrants from Netherlands Female Poverty Correlation Chart
The statistical analysis conducted on geographies consisting of 15,626,462 people shows a slight negative correlation between the proportion of Tsimshian and poverty level among females in the United States with a correlation coefficient (R) of -0.062 and weighted average of 13.1%. Similarly, the statistical analysis conducted on geographies consisting of 237,788,507 people shows a weak positive correlation between the proportion of Immigrants from Netherlands and poverty level among females in the United States with a correlation coefficient (R) of 0.269 and weighted average of 12.2%, a difference of 7.1%.
Female Poverty Correlation Summary
| Measurement | Tsimshian | Immigrants from Netherlands |
| Minimum | 2.2% | 0.30% |
| Maximum | 27.8% | 29.1% |
| Range | 25.6% | 28.8% |
| Mean | 14.0% | 11.0% |
| Median | 13.1% | 9.7% |
| Interquartile 25% (IQ1) | 10.4% | 7.4% |
| Interquartile 75% (IQ3) | 17.6% | 14.1% |
| Interquartile Range (IQR) | 7.2% | 6.7% |
| Standard Deviation (Sample) | 7.2% | 6.3% |
| Standard Deviation (Population) | 6.9% | 6.2% |
Similar Demographics by Female Poverty
Demographics Similar to Tsimshian by Female Poverty
In terms of female poverty, the demographic groups most similar to Tsimshian are Taiwanese (13.1%, a difference of 0.030%), Immigrants from Germany (13.1%, a difference of 0.070%), Yugoslavian (13.1%, a difference of 0.19%), Samoan (13.1%, a difference of 0.24%), and Immigrants from Kazakhstan (13.0%, a difference of 0.44%).
| Demographics | Rating | Rank | Female Poverty |
| Immigrants | Malaysia | 80.4 /100 | #143 | Excellent 13.0% |
| Afghans | 79.8 /100 | #144 | Good 13.0% |
| Syrians | 79.6 /100 | #145 | Good 13.0% |
| Immigrants | Peru | 79.1 /100 | #146 | Good 13.0% |
| Immigrants | Kazakhstan | 78.6 /100 | #147 | Good 13.0% |
| Yugoslavians | 76.9 /100 | #148 | Good 13.1% |
| Taiwanese | 75.7 /100 | #149 | Good 13.1% |
| Tsimshian | 75.5 /100 | #150 | Good 13.1% |
| Immigrants | Germany | 74.9 /100 | #151 | Good 13.1% |
| Samoans | 73.6 /100 | #152 | Good 13.1% |
| Immigrants | Fiji | 71.0 /100 | #153 | Good 13.2% |
| Armenians | 70.4 /100 | #154 | Good 13.2% |
| Hungarians | 70.1 /100 | #155 | Good 13.2% |
| Immigrants | Bosnia and Herzegovina | 69.7 /100 | #156 | Good 13.2% |
| Immigrants | Northern Africa | 68.8 /100 | #157 | Good 13.2% |
Demographics Similar to Immigrants from Netherlands by Female Poverty
In terms of female poverty, the demographic groups most similar to Immigrants from Netherlands are Immigrants from Eastern Asia (12.2%, a difference of 0.040%), Swiss (12.2%, a difference of 0.10%), Immigrants from Belgium (12.2%, a difference of 0.13%), Austrian (12.2%, a difference of 0.17%), and Indian (Asian) (12.2%, a difference of 0.18%).
| Demographics | Rating | Rank | Female Poverty |
| Immigrants | Asia | 98.1 /100 | #61 | Exceptional 12.2% |
| Immigrants | Italy | 98.0 /100 | #62 | Exceptional 12.2% |
| Ukrainians | 98.0 /100 | #63 | Exceptional 12.2% |
| Germans | 98.0 /100 | #64 | Exceptional 12.2% |
| Indians (Asian) | 97.9 /100 | #65 | Exceptional 12.2% |
| Austrians | 97.9 /100 | #66 | Exceptional 12.2% |
| Immigrants | Eastern Asia | 97.8 /100 | #67 | Exceptional 12.2% |
| Immigrants | Netherlands | 97.8 /100 | #68 | Exceptional 12.2% |
| Swiss | 97.7 /100 | #69 | Exceptional 12.2% |
| Immigrants | Belgium | 97.7 /100 | #70 | Exceptional 12.2% |
| Carpatho Rusyns | 97.6 /100 | #71 | Exceptional 12.2% |
| Cambodians | 97.5 /100 | #72 | Exceptional 12.2% |
| Zimbabweans | 97.5 /100 | #73 | Exceptional 12.3% |
| Immigrants | Canada | 97.5 /100 | #74 | Exceptional 12.3% |
| Europeans | 97.4 /100 | #75 | Exceptional 12.3% |