Venezuelan vs Immigrants from Dominica Female Poverty
COMPARE
Venezuelan
Immigrants from Dominica
Female Poverty
Female Poverty Comparison
Venezuelans
Immigrants from Dominica
13.5%
FEMALE POVERTY
44.5/ 100
METRIC RATING
181st/ 347
METRIC RANK
17.5%
FEMALE POVERTY
0.0/ 100
METRIC RATING
320th/ 347
METRIC RANK
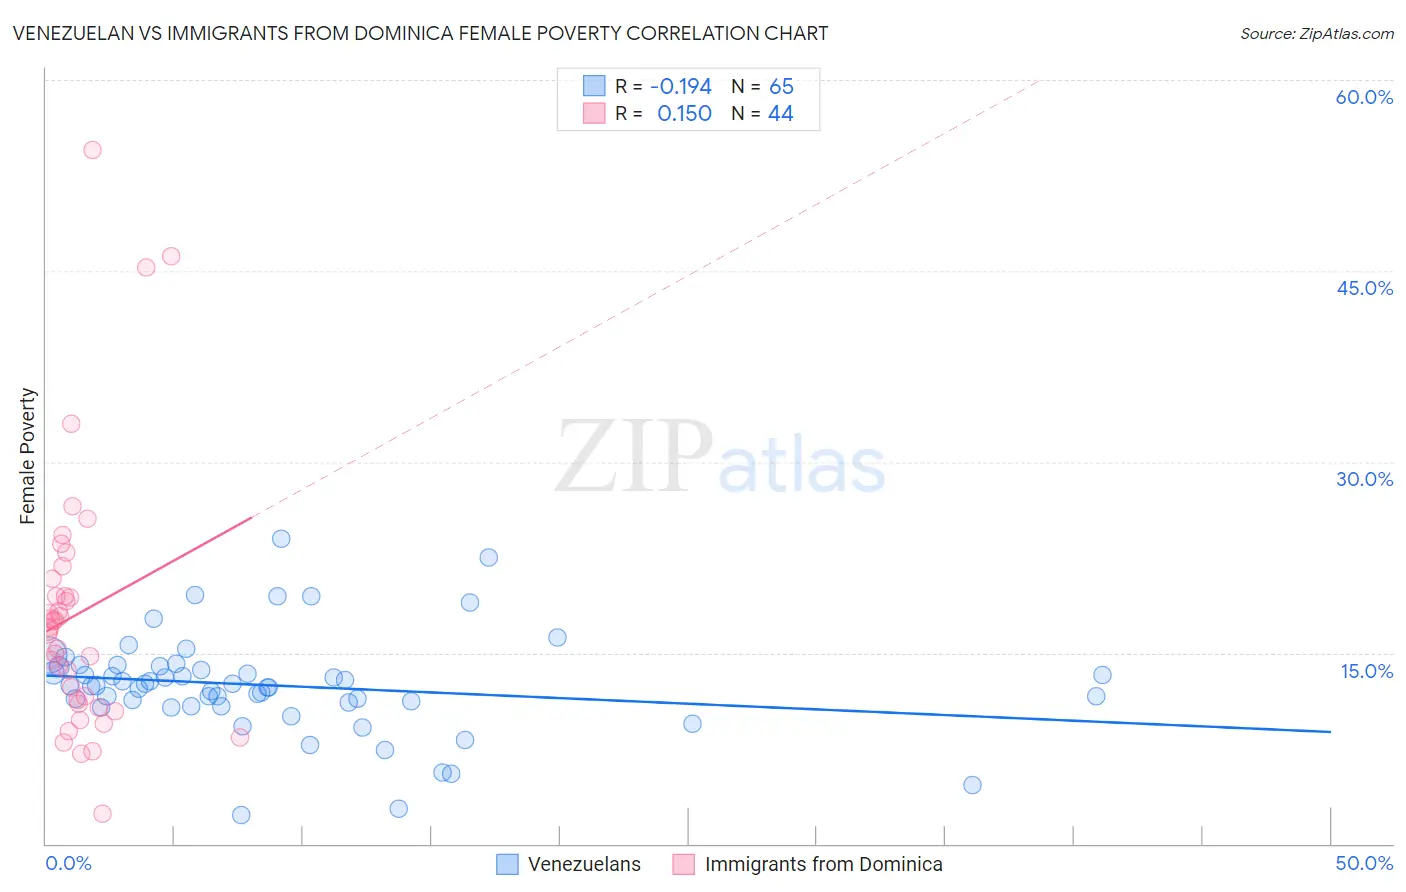
Venezuelan vs Immigrants from Dominica Female Poverty Correlation Chart
The statistical analysis conducted on geographies consisting of 306,079,170 people shows a poor negative correlation between the proportion of Venezuelans and poverty level among females in the United States with a correlation coefficient (R) of -0.194 and weighted average of 13.5%. Similarly, the statistical analysis conducted on geographies consisting of 83,788,429 people shows a poor positive correlation between the proportion of Immigrants from Dominica and poverty level among females in the United States with a correlation coefficient (R) of 0.150 and weighted average of 17.5%, a difference of 29.3%.
Female Poverty Correlation Summary
| Measurement | Venezuelan | Immigrants from Dominica |
| Minimum | 2.3% | 2.4% |
| Maximum | 24.0% | 54.5% |
| Range | 21.7% | 52.1% |
| Mean | 12.4% | 18.0% |
| Median | 12.4% | 16.9% |
| Interquartile 25% (IQ1) | 11.0% | 11.1% |
| Interquartile 75% (IQ3) | 13.9% | 20.1% |
| Interquartile Range (IQR) | 2.9% | 9.0% |
| Standard Deviation (Sample) | 3.9% | 10.3% |
| Standard Deviation (Population) | 3.9% | 10.2% |
Similar Demographics by Female Poverty
Demographics Similar to Venezuelans by Female Poverty
In terms of female poverty, the demographic groups most similar to Venezuelans are Immigrants from Colombia (13.5%, a difference of 0.0%), South American (13.5%, a difference of 0.030%), Kenyan (13.5%, a difference of 0.070%), Immigrants from Sierra Leone (13.5%, a difference of 0.13%), and Immigrants from Cameroon (13.5%, a difference of 0.24%).
| Demographics | Rating | Rank | Female Poverty |
| Immigrants | Iraq | 50.0 /100 | #174 | Average 13.4% |
| Celtics | 49.9 /100 | #175 | Average 13.4% |
| Immigrants | Spain | 49.9 /100 | #176 | Average 13.4% |
| Immigrants | Morocco | 49.4 /100 | #177 | Average 13.4% |
| Israelis | 49.1 /100 | #178 | Average 13.5% |
| Immigrants | Syria | 48.8 /100 | #179 | Average 13.5% |
| South Americans | 44.8 /100 | #180 | Average 13.5% |
| Venezuelans | 44.5 /100 | #181 | Average 13.5% |
| Immigrants | Colombia | 44.5 /100 | #182 | Average 13.5% |
| Kenyans | 43.8 /100 | #183 | Average 13.5% |
| Immigrants | Sierra Leone | 43.2 /100 | #184 | Average 13.5% |
| Immigrants | Cameroon | 42.0 /100 | #185 | Average 13.5% |
| Immigrants | Portugal | 41.5 /100 | #186 | Average 13.6% |
| Immigrants | Venezuela | 41.0 /100 | #187 | Average 13.6% |
| Hawaiians | 39.9 /100 | #188 | Fair 13.6% |
Demographics Similar to Immigrants from Dominica by Female Poverty
In terms of female poverty, the demographic groups most similar to Immigrants from Dominica are Arapaho (17.5%, a difference of 0.060%), Cajun (17.5%, a difference of 0.080%), Ute (17.5%, a difference of 0.10%), Immigrants from Congo (17.4%, a difference of 0.42%), and Honduran (17.4%, a difference of 0.61%).
| Demographics | Rating | Rank | Female Poverty |
| British West Indians | 0.0 /100 | #313 | Tragic 17.0% |
| Dutch West Indians | 0.0 /100 | #314 | Tragic 17.1% |
| U.S. Virgin Islanders | 0.0 /100 | #315 | Tragic 17.3% |
| Hondurans | 0.0 /100 | #316 | Tragic 17.4% |
| Immigrants | Congo | 0.0 /100 | #317 | Tragic 17.4% |
| Ute | 0.0 /100 | #318 | Tragic 17.5% |
| Cajuns | 0.0 /100 | #319 | Tragic 17.5% |
| Immigrants | Dominica | 0.0 /100 | #320 | Tragic 17.5% |
| Arapaho | 0.0 /100 | #321 | Tragic 17.5% |
| Menominee | 0.0 /100 | #322 | Tragic 17.6% |
| Paiute | 0.0 /100 | #323 | Tragic 17.7% |
| Immigrants | Honduras | 0.0 /100 | #324 | Tragic 17.7% |
| Colville | 0.0 /100 | #325 | Tragic 17.8% |
| Central American Indians | 0.0 /100 | #326 | Tragic 18.0% |
| Yakama | 0.0 /100 | #327 | Tragic 18.0% |