Subsaharan African vs Lumbee Female Poverty
COMPARE
Subsaharan African
Lumbee
Female Poverty
Female Poverty Comparison
Sub-Saharan Africans
Lumbee
15.8%
FEMALE POVERTY
0.1/ 100
METRIC RATING
267th/ 347
METRIC RANK
23.5%
FEMALE POVERTY
0.0/ 100
METRIC RATING
343rd/ 347
METRIC RANK
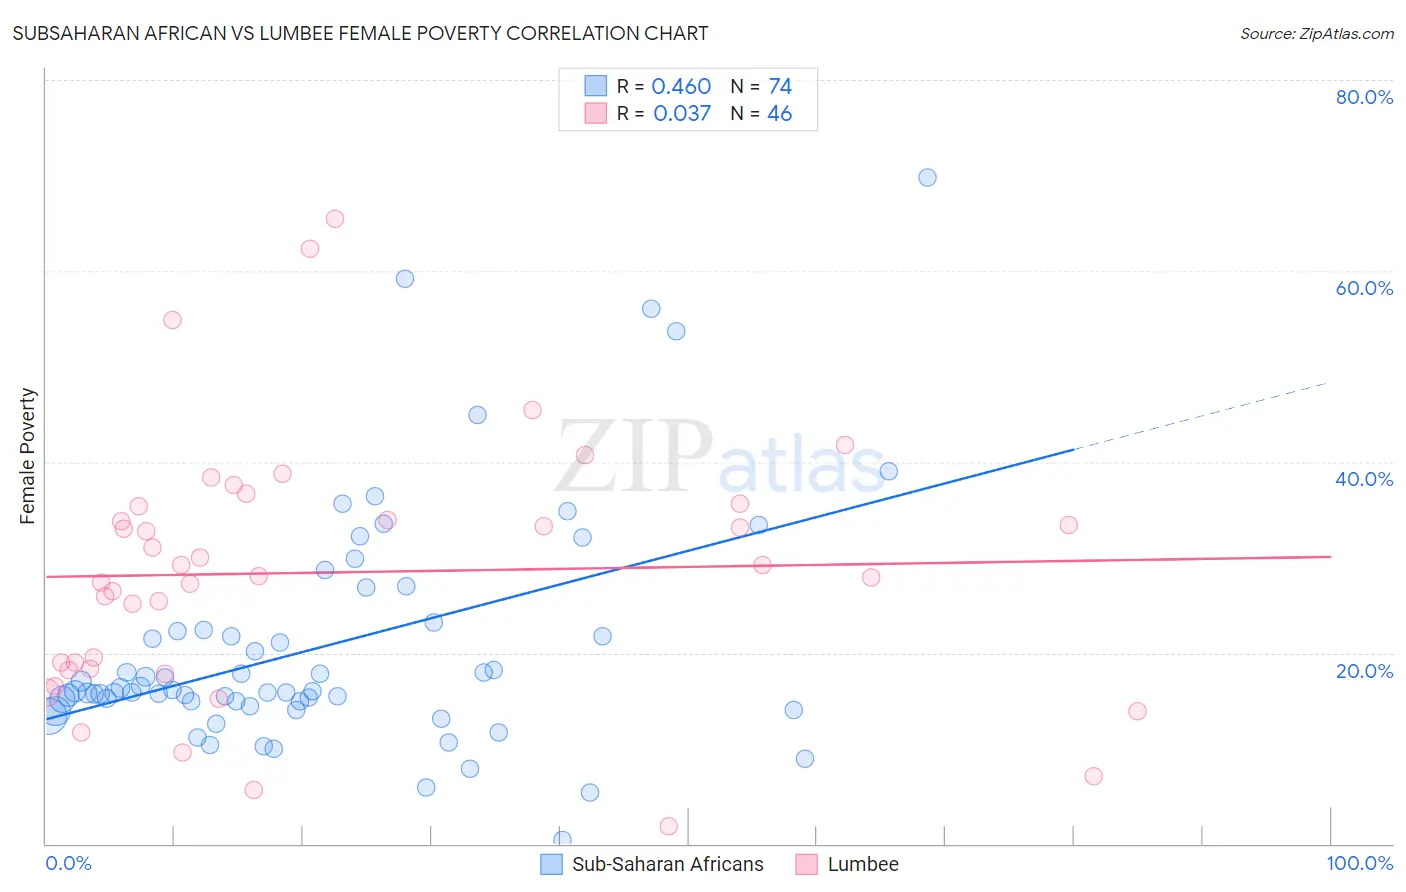
Subsaharan African vs Lumbee Female Poverty Correlation Chart
The statistical analysis conducted on geographies consisting of 507,469,907 people shows a moderate positive correlation between the proportion of Sub-Saharan Africans and poverty level among females in the United States with a correlation coefficient (R) of 0.460 and weighted average of 15.8%. Similarly, the statistical analysis conducted on geographies consisting of 92,256,229 people shows no correlation between the proportion of Lumbee and poverty level among females in the United States with a correlation coefficient (R) of 0.037 and weighted average of 23.5%, a difference of 49.2%.
Female Poverty Correlation Summary
| Measurement | Subsaharan African | Lumbee |
| Minimum | 0.38% | 1.9% |
| Maximum | 69.8% | 65.5% |
| Range | 69.4% | 63.6% |
| Mean | 20.8% | 28.4% |
| Median | 16.0% | 28.6% |
| Interquartile 25% (IQ1) | 14.9% | 18.3% |
| Interquartile 75% (IQ3) | 22.4% | 35.3% |
| Interquartile Range (IQR) | 7.5% | 17.0% |
| Standard Deviation (Sample) | 12.5% | 13.4% |
| Standard Deviation (Population) | 12.4% | 13.3% |
Similar Demographics by Female Poverty
Demographics Similar to Sub-Saharan Africans by Female Poverty
In terms of female poverty, the demographic groups most similar to Sub-Saharan Africans are Immigrants from Nicaragua (15.8%, a difference of 0.060%), Immigrants from El Salvador (15.7%, a difference of 0.43%), Iroquois (15.8%, a difference of 0.43%), Immigrants from Liberia (15.7%, a difference of 0.49%), and Chickasaw (15.9%, a difference of 0.69%).
| Demographics | Rating | Rank | Female Poverty |
| Immigrants | Guyana | 0.1 /100 | #260 | Tragic 15.6% |
| Guyanese | 0.1 /100 | #261 | Tragic 15.6% |
| Mexican American Indians | 0.1 /100 | #262 | Tragic 15.6% |
| Cherokee | 0.1 /100 | #263 | Tragic 15.6% |
| Immigrants | Ecuador | 0.1 /100 | #264 | Tragic 15.6% |
| Immigrants | Liberia | 0.1 /100 | #265 | Tragic 15.7% |
| Immigrants | El Salvador | 0.1 /100 | #266 | Tragic 15.7% |
| Sub-Saharan Africans | 0.1 /100 | #267 | Tragic 15.8% |
| Immigrants | Nicaragua | 0.1 /100 | #268 | Tragic 15.8% |
| Iroquois | 0.1 /100 | #269 | Tragic 15.8% |
| Chickasaw | 0.1 /100 | #270 | Tragic 15.9% |
| Immigrants | St. Vincent and the Grenadines | 0.0 /100 | #271 | Tragic 15.9% |
| Belizeans | 0.0 /100 | #272 | Tragic 15.9% |
| Haitians | 0.0 /100 | #273 | Tragic 15.9% |
| Barbadians | 0.0 /100 | #274 | Tragic 15.9% |
Demographics Similar to Lumbee by Female Poverty
In terms of female poverty, the demographic groups most similar to Lumbee are Pima (23.6%, a difference of 0.31%), Navajo (23.9%, a difference of 1.6%), Immigrants from Yemen (22.8%, a difference of 3.0%), Crow (22.1%, a difference of 6.2%), and Puerto Rican (25.2%, a difference of 7.1%).
| Demographics | Rating | Rank | Female Poverty |
| Immigrants | Dominican Republic | 0.0 /100 | #333 | Tragic 19.3% |
| Houma | 0.0 /100 | #334 | Tragic 20.0% |
| Cheyenne | 0.0 /100 | #335 | Tragic 20.2% |
| Pueblo | 0.0 /100 | #336 | Tragic 20.7% |
| Yuman | 0.0 /100 | #337 | Tragic 20.8% |
| Sioux | 0.0 /100 | #338 | Tragic 20.9% |
| Hopi | 0.0 /100 | #339 | Tragic 21.0% |
| Yup'ik | 0.0 /100 | #340 | Tragic 21.5% |
| Crow | 0.0 /100 | #341 | Tragic 22.1% |
| Immigrants | Yemen | 0.0 /100 | #342 | Tragic 22.8% |
| Lumbee | 0.0 /100 | #343 | Tragic 23.5% |
| Pima | 0.0 /100 | #344 | Tragic 23.6% |
| Navajo | 0.0 /100 | #345 | Tragic 23.9% |
| Puerto Ricans | 0.0 /100 | #346 | Tragic 25.2% |
| Tohono O'odham | 0.0 /100 | #347 | Tragic 25.9% |