Subsaharan African vs Lumbee 12th Grade, No Diploma
COMPARE
Subsaharan African
Lumbee
12th Grade, No Diploma
12th Grade, No Diploma Comparison
Sub-Saharan Africans
Lumbee
90.1%
12TH GRADE, NO DIPLOMA
1.9/ 100
METRIC RATING
239th/ 347
METRIC RANK
85.7%
12TH GRADE, NO DIPLOMA
0.0/ 100
METRIC RATING
327th/ 347
METRIC RANK
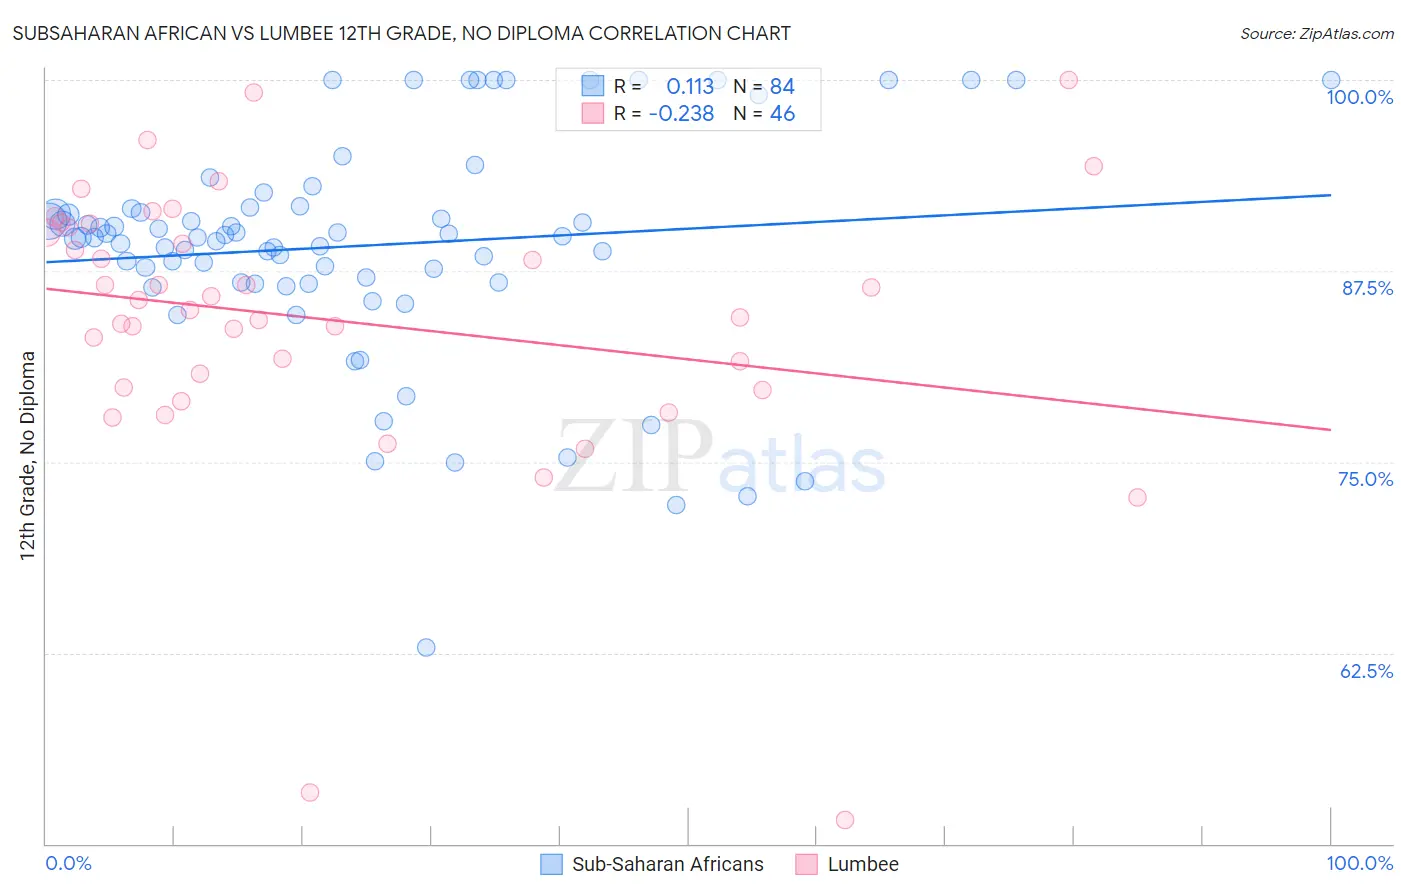
Subsaharan African vs Lumbee 12th Grade, No Diploma Correlation Chart
The statistical analysis conducted on geographies consisting of 508,219,008 people shows a poor positive correlation between the proportion of Sub-Saharan Africans and percentage of population with at least 12th grade (no diploma) education in the United States with a correlation coefficient (R) of 0.113 and weighted average of 90.1%. Similarly, the statistical analysis conducted on geographies consisting of 92,299,068 people shows a weak negative correlation between the proportion of Lumbee and percentage of population with at least 12th grade (no diploma) education in the United States with a correlation coefficient (R) of -0.238 and weighted average of 85.7%, a difference of 5.1%.
12th Grade, No Diploma Correlation Summary
| Measurement | Subsaharan African | Lumbee |
| Minimum | 62.8% | 51.6% |
| Maximum | 100.0% | 100.0% |
| Range | 37.2% | 48.4% |
| Mean | 89.2% | 84.3% |
| Median | 89.7% | 85.3% |
| Interquartile 25% (IQ1) | 86.7% | 79.8% |
| Interquartile 75% (IQ3) | 91.6% | 90.3% |
| Interquartile Range (IQR) | 4.9% | 10.5% |
| Standard Deviation (Sample) | 7.3% | 9.3% |
| Standard Deviation (Population) | 7.3% | 9.2% |
Similar Demographics by 12th Grade, No Diploma
Demographics Similar to Sub-Saharan Africans by 12th Grade, No Diploma
In terms of 12th grade, no diploma, the demographic groups most similar to Sub-Saharan Africans are Inupiat (90.1%, a difference of 0.020%), Kiowa (90.0%, a difference of 0.020%), Immigrants from Colombia (90.1%, a difference of 0.030%), Immigrants from Middle Africa (90.0%, a difference of 0.030%), and Immigrants from Uzbekistan (90.1%, a difference of 0.050%).
| Demographics | Rating | Rank | 12th Grade, No Diploma |
| Blackfeet | 2.4 /100 | #232 | Tragic 90.1% |
| Immigrants | Thailand | 2.3 /100 | #233 | Tragic 90.1% |
| Immigrants | South America | 2.3 /100 | #234 | Tragic 90.1% |
| Colville | 2.3 /100 | #235 | Tragic 90.1% |
| Immigrants | Uzbekistan | 2.2 /100 | #236 | Tragic 90.1% |
| Immigrants | Colombia | 2.1 /100 | #237 | Tragic 90.1% |
| Inupiat | 2.0 /100 | #238 | Tragic 90.1% |
| Sub-Saharan Africans | 1.9 /100 | #239 | Tragic 90.1% |
| Kiowa | 1.7 /100 | #240 | Tragic 90.0% |
| Immigrants | Middle Africa | 1.7 /100 | #241 | Tragic 90.0% |
| Immigrants | Costa Rica | 1.6 /100 | #242 | Tragic 90.0% |
| Crow | 1.5 /100 | #243 | Tragic 90.0% |
| Taiwanese | 1.5 /100 | #244 | Tragic 90.0% |
| Immigrants | Uruguay | 1.4 /100 | #245 | Tragic 90.0% |
| Ghanaians | 1.3 /100 | #246 | Tragic 90.0% |
Demographics Similar to Lumbee by 12th Grade, No Diploma
In terms of 12th grade, no diploma, the demographic groups most similar to Lumbee are Dominican (85.7%, a difference of 0.010%), Mexican American Indian (85.7%, a difference of 0.030%), Immigrants from Cabo Verde (85.8%, a difference of 0.10%), Honduran (85.5%, a difference of 0.19%), and Hispanic or Latino (85.4%, a difference of 0.28%).
| Demographics | Rating | Rank | 12th Grade, No Diploma |
| Immigrants | Nicaragua | 0.0 /100 | #320 | Tragic 86.6% |
| Puerto Ricans | 0.0 /100 | #321 | Tragic 86.5% |
| Central American Indians | 0.0 /100 | #322 | Tragic 86.5% |
| Yuman | 0.0 /100 | #323 | Tragic 86.5% |
| Immigrants | Cabo Verde | 0.0 /100 | #324 | Tragic 85.8% |
| Mexican American Indians | 0.0 /100 | #325 | Tragic 85.7% |
| Dominicans | 0.0 /100 | #326 | Tragic 85.7% |
| Lumbee | 0.0 /100 | #327 | Tragic 85.7% |
| Hondurans | 0.0 /100 | #328 | Tragic 85.5% |
| Hispanics or Latinos | 0.0 /100 | #329 | Tragic 85.4% |
| Immigrants | Azores | 0.0 /100 | #330 | Tragic 85.3% |
| Central Americans | 0.0 /100 | #331 | Tragic 85.2% |
| Immigrants | Honduras | 0.0 /100 | #332 | Tragic 85.0% |
| Immigrants | Latin America | 0.0 /100 | #333 | Tragic 85.0% |
| Immigrants | Dominican Republic | 0.0 /100 | #334 | Tragic 84.9% |