Immigrants from India vs Lumbee Female Poverty
COMPARE
Immigrants from India
Lumbee
Female Poverty
Female Poverty Comparison
Immigrants from India
Lumbee
9.9%
FEMALE POVERTY
100.0/ 100
METRIC RATING
1st/ 347
METRIC RANK
23.5%
FEMALE POVERTY
0.0/ 100
METRIC RATING
343rd/ 347
METRIC RANK
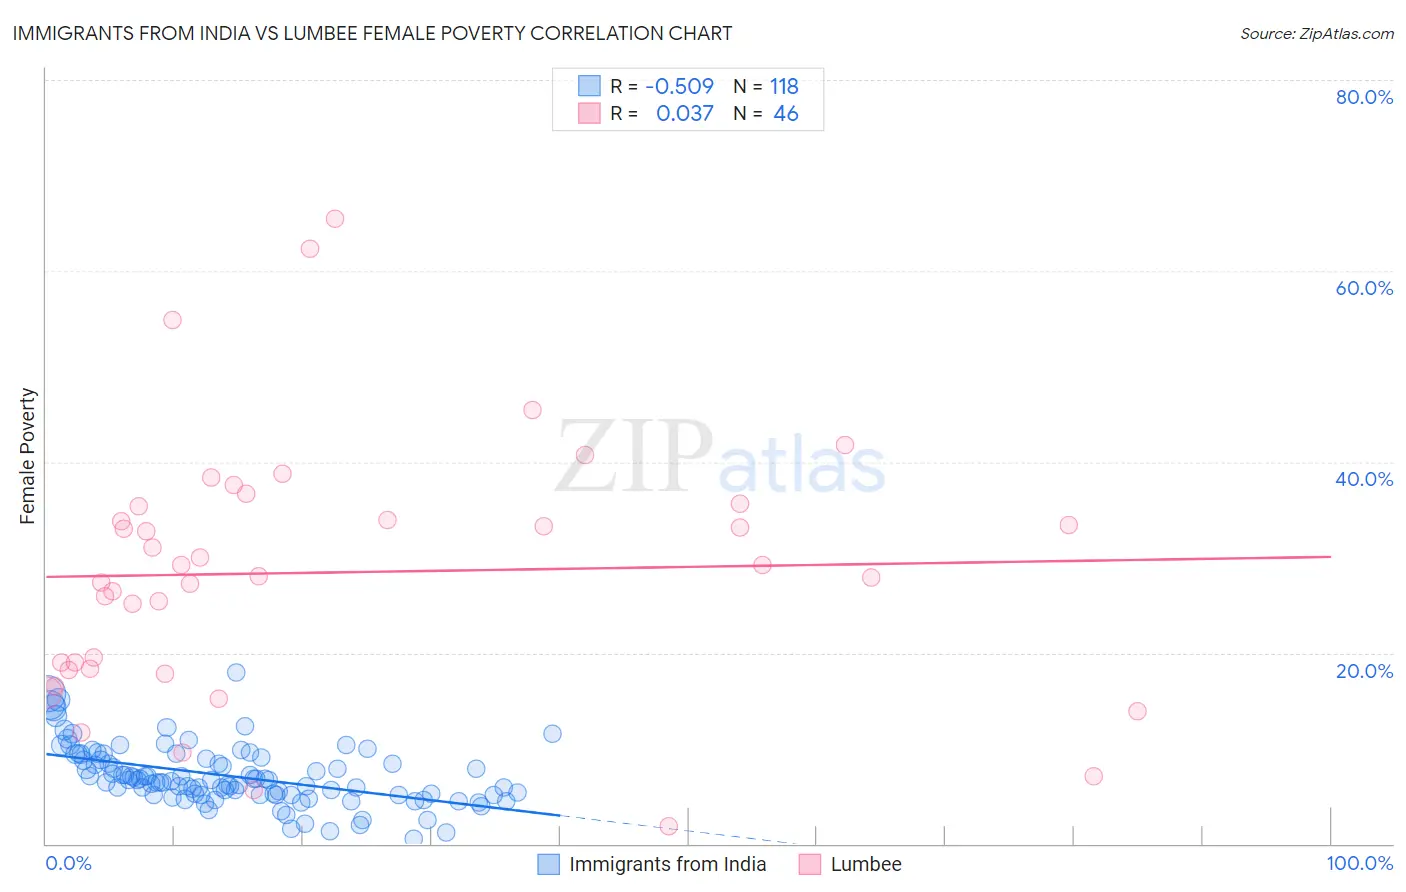
Immigrants from India vs Lumbee Female Poverty Correlation Chart
The statistical analysis conducted on geographies consisting of 433,627,117 people shows a substantial negative correlation between the proportion of Immigrants from India and poverty level among females in the United States with a correlation coefficient (R) of -0.509 and weighted average of 9.9%. Similarly, the statistical analysis conducted on geographies consisting of 92,256,229 people shows no correlation between the proportion of Lumbee and poverty level among females in the United States with a correlation coefficient (R) of 0.037 and weighted average of 23.5%, a difference of 138.0%.
Female Poverty Correlation Summary
| Measurement | Immigrants from India | Lumbee |
| Minimum | 0.46% | 1.9% |
| Maximum | 17.9% | 65.5% |
| Range | 17.5% | 63.6% |
| Mean | 7.1% | 28.4% |
| Median | 6.7% | 28.6% |
| Interquartile 25% (IQ1) | 5.1% | 18.3% |
| Interquartile 75% (IQ3) | 9.0% | 35.3% |
| Interquartile Range (IQR) | 3.8% | 17.0% |
| Standard Deviation (Sample) | 3.1% | 13.4% |
| Standard Deviation (Population) | 3.1% | 13.3% |
Similar Demographics by Female Poverty
Demographics Similar to Immigrants from India by Female Poverty
In terms of female poverty, the demographic groups most similar to Immigrants from India are Chinese (10.4%, a difference of 5.2%), Thai (10.5%, a difference of 5.9%), Immigrants from Taiwan (10.5%, a difference of 6.7%), Filipino (10.9%, a difference of 10.8%), and Immigrants from Ireland (11.0%, a difference of 11.3%).
| Demographics | Rating | Rank | Female Poverty |
| Immigrants | India | 100.0 /100 | #1 | Exceptional 9.9% |
| Chinese | 100.0 /100 | #2 | Exceptional 10.4% |
| Thais | 100.0 /100 | #3 | Exceptional 10.5% |
| Immigrants | Taiwan | 100.0 /100 | #4 | Exceptional 10.5% |
| Filipinos | 100.0 /100 | #5 | Exceptional 10.9% |
| Immigrants | Ireland | 99.9 /100 | #6 | Exceptional 11.0% |
| Assyrians/Chaldeans/Syriacs | 99.9 /100 | #7 | Exceptional 11.0% |
| Immigrants | South Central Asia | 99.9 /100 | #8 | Exceptional 11.1% |
| Bulgarians | 99.9 /100 | #9 | Exceptional 11.1% |
| Immigrants | Hong Kong | 99.9 /100 | #10 | Exceptional 11.2% |
| Maltese | 99.9 /100 | #11 | Exceptional 11.2% |
| Bhutanese | 99.9 /100 | #12 | Exceptional 11.3% |
| Immigrants | Lithuania | 99.9 /100 | #13 | Exceptional 11.3% |
| Lithuanians | 99.8 /100 | #14 | Exceptional 11.4% |
| Latvians | 99.8 /100 | #15 | Exceptional 11.4% |
Demographics Similar to Lumbee by Female Poverty
In terms of female poverty, the demographic groups most similar to Lumbee are Pima (23.6%, a difference of 0.31%), Navajo (23.9%, a difference of 1.6%), Immigrants from Yemen (22.8%, a difference of 3.0%), Crow (22.1%, a difference of 6.2%), and Puerto Rican (25.2%, a difference of 7.1%).
| Demographics | Rating | Rank | Female Poverty |
| Immigrants | Dominican Republic | 0.0 /100 | #333 | Tragic 19.3% |
| Houma | 0.0 /100 | #334 | Tragic 20.0% |
| Cheyenne | 0.0 /100 | #335 | Tragic 20.2% |
| Pueblo | 0.0 /100 | #336 | Tragic 20.7% |
| Yuman | 0.0 /100 | #337 | Tragic 20.8% |
| Sioux | 0.0 /100 | #338 | Tragic 20.9% |
| Hopi | 0.0 /100 | #339 | Tragic 21.0% |
| Yup'ik | 0.0 /100 | #340 | Tragic 21.5% |
| Crow | 0.0 /100 | #341 | Tragic 22.1% |
| Immigrants | Yemen | 0.0 /100 | #342 | Tragic 22.8% |
| Lumbee | 0.0 /100 | #343 | Tragic 23.5% |
| Pima | 0.0 /100 | #344 | Tragic 23.6% |
| Navajo | 0.0 /100 | #345 | Tragic 23.9% |
| Puerto Ricans | 0.0 /100 | #346 | Tragic 25.2% |
| Tohono O'odham | 0.0 /100 | #347 | Tragic 25.9% |