Subsaharan African vs Lumbee Disability Age 18 to 34
COMPARE
Subsaharan African
Lumbee
Disability Age 18 to 34
Disability Age 18 to 34 Comparison
Sub-Saharan Africans
Lumbee
7.1%
DISABILITY AGE 18 TO 34
1.7/ 100
METRIC RATING
235th/ 347
METRIC RANK
7.4%
DISABILITY AGE 18 TO 34
0.1/ 100
METRIC RATING
278th/ 347
METRIC RANK
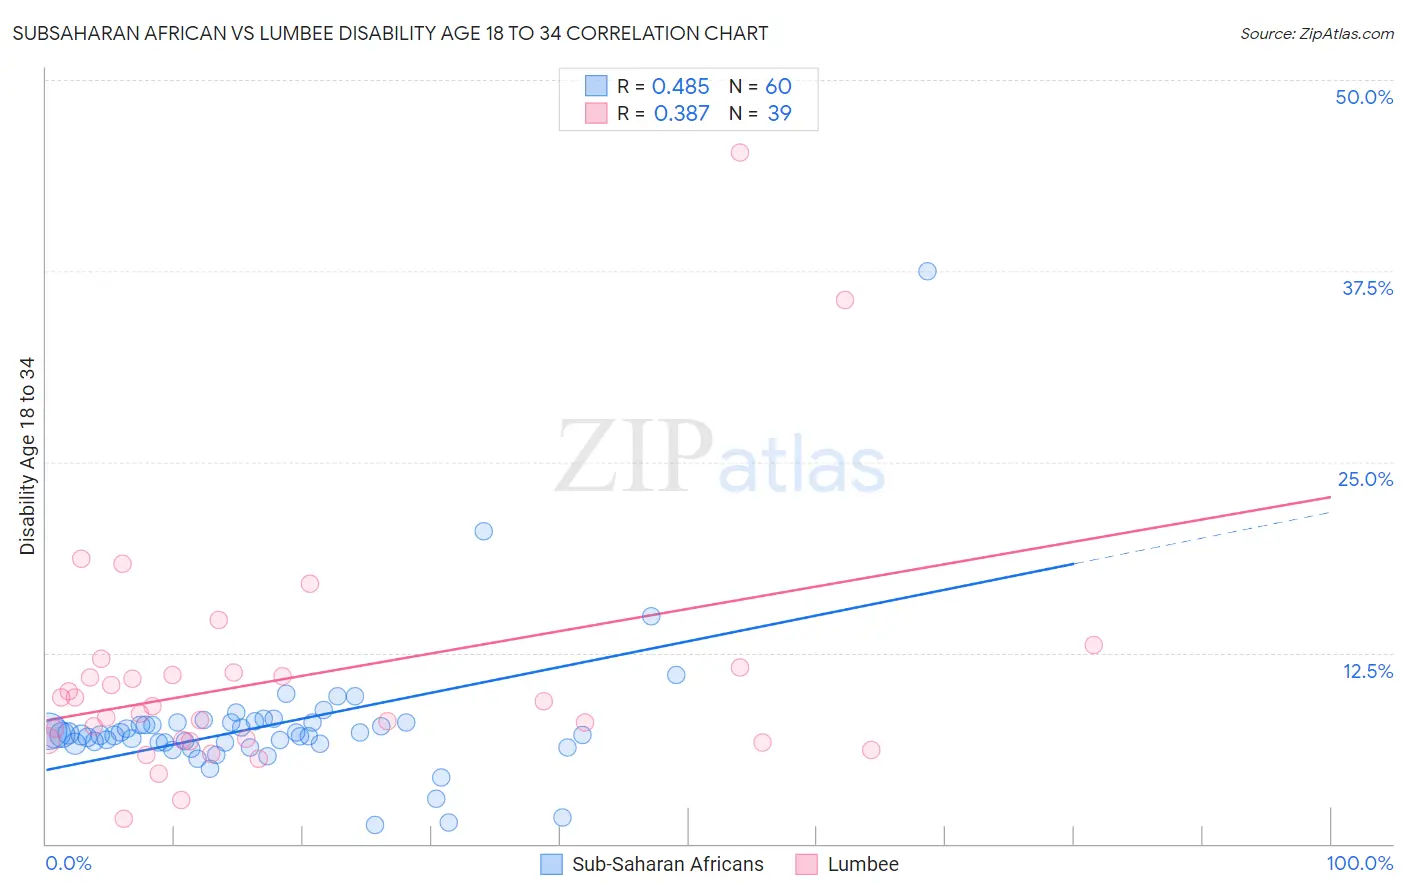
Subsaharan African vs Lumbee Disability Age 18 to 34 Correlation Chart
The statistical analysis conducted on geographies consisting of 506,334,183 people shows a moderate positive correlation between the proportion of Sub-Saharan Africans and percentage of population with a disability between the ages 18 and 35 in the United States with a correlation coefficient (R) of 0.485 and weighted average of 7.1%. Similarly, the statistical analysis conducted on geographies consisting of 92,228,485 people shows a mild positive correlation between the proportion of Lumbee and percentage of population with a disability between the ages 18 and 35 in the United States with a correlation coefficient (R) of 0.387 and weighted average of 7.4%, a difference of 5.3%.
Disability Age 18 to 34 Correlation Summary
| Measurement | Subsaharan African | Lumbee |
| Minimum | 1.2% | 1.6% |
| Maximum | 37.5% | 45.3% |
| Range | 36.3% | 43.7% |
| Mean | 7.8% | 10.8% |
| Median | 7.1% | 9.0% |
| Interquartile 25% (IQ1) | 6.6% | 6.7% |
| Interquartile 75% (IQ3) | 7.9% | 11.2% |
| Interquartile Range (IQR) | 1.4% | 4.5% |
| Standard Deviation (Sample) | 4.7% | 8.0% |
| Standard Deviation (Population) | 4.7% | 7.9% |
Similar Demographics by Disability Age 18 to 34
Demographics Similar to Sub-Saharan Africans by Disability Age 18 to 34
In terms of disability age 18 to 34, the demographic groups most similar to Sub-Saharan Africans are Liberian (7.1%, a difference of 0.25%), Alsatian (7.0%, a difference of 0.37%), Austrian (7.1%, a difference of 0.42%), Marshallese (7.1%, a difference of 0.47%), and Italian (7.1%, a difference of 0.58%).
| Demographics | Rating | Rank | Disability Age 18 to 34 |
| Immigrants | Yemen | 4.2 /100 | #228 | Tragic 7.0% |
| Lithuanians | 4.1 /100 | #229 | Tragic 7.0% |
| Immigrants | North America | 3.9 /100 | #230 | Tragic 7.0% |
| Ute | 3.8 /100 | #231 | Tragic 7.0% |
| Samoans | 3.2 /100 | #232 | Tragic 7.0% |
| New Zealanders | 2.7 /100 | #233 | Tragic 7.0% |
| Alsatians | 2.1 /100 | #234 | Tragic 7.0% |
| Sub-Saharan Africans | 1.7 /100 | #235 | Tragic 7.1% |
| Liberians | 1.5 /100 | #236 | Tragic 7.1% |
| Austrians | 1.3 /100 | #237 | Tragic 7.1% |
| Marshallese | 1.3 /100 | #238 | Tragic 7.1% |
| Italians | 1.2 /100 | #239 | Tragic 7.1% |
| Arapaho | 1.1 /100 | #240 | Tragic 7.1% |
| Nepalese | 1.1 /100 | #241 | Tragic 7.1% |
| Immigrants | Congo | 1.1 /100 | #242 | Tragic 7.1% |
Demographics Similar to Lumbee by Disability Age 18 to 34
In terms of disability age 18 to 34, the demographic groups most similar to Lumbee are Immigrants from Portugal (7.4%, a difference of 0.030%), Czechoslovakian (7.4%, a difference of 0.040%), Yaqui (7.4%, a difference of 0.050%), European (7.4%, a difference of 0.46%), and Immigrants from Somalia (7.4%, a difference of 0.51%).
| Demographics | Rating | Rank | Disability Age 18 to 34 |
| Swiss | 0.1 /100 | #271 | Tragic 7.4% |
| Tsimshian | 0.1 /100 | #272 | Tragic 7.4% |
| Slavs | 0.1 /100 | #273 | Tragic 7.4% |
| Africans | 0.1 /100 | #274 | Tragic 7.4% |
| Immigrants | Somalia | 0.1 /100 | #275 | Tragic 7.4% |
| Europeans | 0.1 /100 | #276 | Tragic 7.4% |
| Immigrants | Portugal | 0.1 /100 | #277 | Tragic 7.4% |
| Lumbee | 0.1 /100 | #278 | Tragic 7.4% |
| Czechoslovakians | 0.1 /100 | #279 | Tragic 7.4% |
| Yaqui | 0.1 /100 | #280 | Tragic 7.4% |
| Paiute | 0.0 /100 | #281 | Tragic 7.5% |
| Spanish | 0.0 /100 | #282 | Tragic 7.5% |
| Danes | 0.0 /100 | #283 | Tragic 7.5% |
| Hopi | 0.0 /100 | #284 | Tragic 7.5% |
| Swedes | 0.0 /100 | #285 | Tragic 7.5% |