Somali vs Lumbee Female Poverty
COMPARE
Somali
Lumbee
Female Poverty
Female Poverty Comparison
Somalis
Lumbee
16.6%
FEMALE POVERTY
0.0/ 100
METRIC RATING
298th/ 347
METRIC RANK
23.5%
FEMALE POVERTY
0.0/ 100
METRIC RATING
343rd/ 347
METRIC RANK
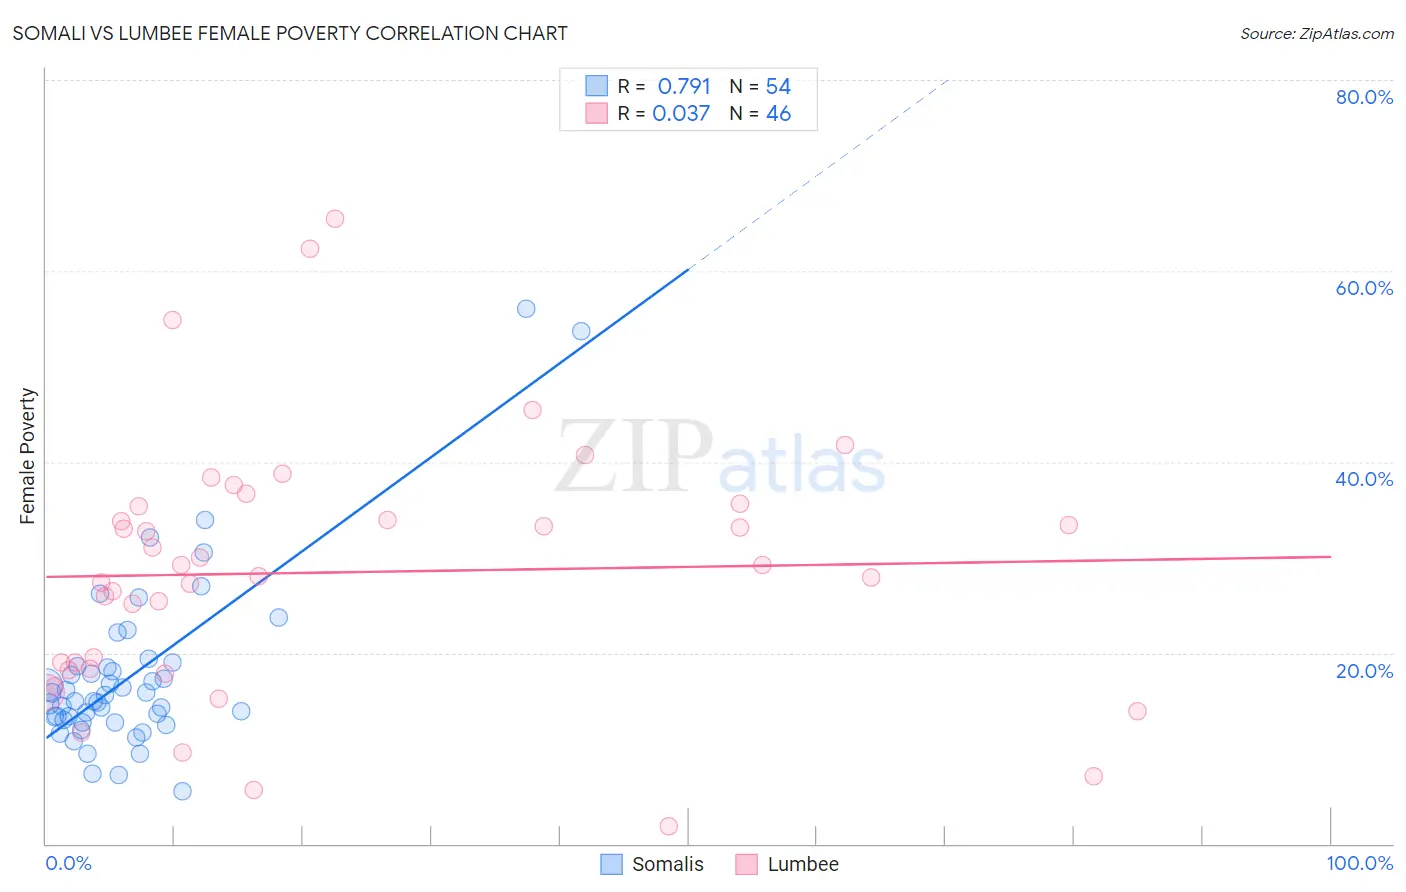
Somali vs Lumbee Female Poverty Correlation Chart
The statistical analysis conducted on geographies consisting of 99,282,230 people shows a strong positive correlation between the proportion of Somalis and poverty level among females in the United States with a correlation coefficient (R) of 0.791 and weighted average of 16.6%. Similarly, the statistical analysis conducted on geographies consisting of 92,256,229 people shows no correlation between the proportion of Lumbee and poverty level among females in the United States with a correlation coefficient (R) of 0.037 and weighted average of 23.5%, a difference of 42.0%.
Female Poverty Correlation Summary
| Measurement | Somali | Lumbee |
| Minimum | 5.5% | 1.9% |
| Maximum | 56.1% | 65.5% |
| Range | 50.6% | 63.6% |
| Mean | 17.8% | 28.4% |
| Median | 15.2% | 28.6% |
| Interquartile 25% (IQ1) | 13.0% | 18.3% |
| Interquartile 75% (IQ3) | 18.6% | 35.3% |
| Interquartile Range (IQR) | 5.6% | 17.0% |
| Standard Deviation (Sample) | 9.4% | 13.4% |
| Standard Deviation (Population) | 9.3% | 13.3% |
Similar Demographics by Female Poverty
Demographics Similar to Somalis by Female Poverty
In terms of female poverty, the demographic groups most similar to Somalis are Mexican (16.5%, a difference of 0.20%), Hispanic or Latino (16.6%, a difference of 0.52%), Bahamian (16.6%, a difference of 0.56%), Immigrants from Senegal (16.5%, a difference of 0.60%), and Senegalese (16.5%, a difference of 0.62%).
| Demographics | Rating | Rank | Female Poverty |
| Yaqui | 0.0 /100 | #291 | Tragic 16.4% |
| Immigrants | Zaire | 0.0 /100 | #292 | Tragic 16.4% |
| Immigrants | Latin America | 0.0 /100 | #293 | Tragic 16.4% |
| Immigrants | Cabo Verde | 0.0 /100 | #294 | Tragic 16.4% |
| Senegalese | 0.0 /100 | #295 | Tragic 16.5% |
| Immigrants | Senegal | 0.0 /100 | #296 | Tragic 16.5% |
| Mexicans | 0.0 /100 | #297 | Tragic 16.5% |
| Somalis | 0.0 /100 | #298 | Tragic 16.6% |
| Hispanics or Latinos | 0.0 /100 | #299 | Tragic 16.6% |
| Bahamians | 0.0 /100 | #300 | Tragic 16.6% |
| Guatemalans | 0.0 /100 | #301 | Tragic 16.7% |
| Chippewa | 0.0 /100 | #302 | Tragic 16.7% |
| Choctaw | 0.0 /100 | #303 | Tragic 16.8% |
| Immigrants | Central America | 0.0 /100 | #304 | Tragic 16.8% |
| Immigrants | Grenada | 0.0 /100 | #305 | Tragic 16.8% |
Demographics Similar to Lumbee by Female Poverty
In terms of female poverty, the demographic groups most similar to Lumbee are Pima (23.6%, a difference of 0.31%), Navajo (23.9%, a difference of 1.6%), Immigrants from Yemen (22.8%, a difference of 3.0%), Crow (22.1%, a difference of 6.2%), and Puerto Rican (25.2%, a difference of 7.1%).
| Demographics | Rating | Rank | Female Poverty |
| Immigrants | Dominican Republic | 0.0 /100 | #333 | Tragic 19.3% |
| Houma | 0.0 /100 | #334 | Tragic 20.0% |
| Cheyenne | 0.0 /100 | #335 | Tragic 20.2% |
| Pueblo | 0.0 /100 | #336 | Tragic 20.7% |
| Yuman | 0.0 /100 | #337 | Tragic 20.8% |
| Sioux | 0.0 /100 | #338 | Tragic 20.9% |
| Hopi | 0.0 /100 | #339 | Tragic 21.0% |
| Yup'ik | 0.0 /100 | #340 | Tragic 21.5% |
| Crow | 0.0 /100 | #341 | Tragic 22.1% |
| Immigrants | Yemen | 0.0 /100 | #342 | Tragic 22.8% |
| Lumbee | 0.0 /100 | #343 | Tragic 23.5% |
| Pima | 0.0 /100 | #344 | Tragic 23.6% |
| Navajo | 0.0 /100 | #345 | Tragic 23.9% |
| Puerto Ricans | 0.0 /100 | #346 | Tragic 25.2% |
| Tohono O'odham | 0.0 /100 | #347 | Tragic 25.9% |