Subsaharan African vs Slovene Female Poverty
COMPARE
Subsaharan African
Slovene
Female Poverty
Female Poverty Comparison
Sub-Saharan Africans
Slovenes
15.8%
FEMALE POVERTY
0.1/ 100
METRIC RATING
267th/ 347
METRIC RANK
12.0%
FEMALE POVERTY
98.9/ 100
METRIC RATING
50th/ 347
METRIC RANK
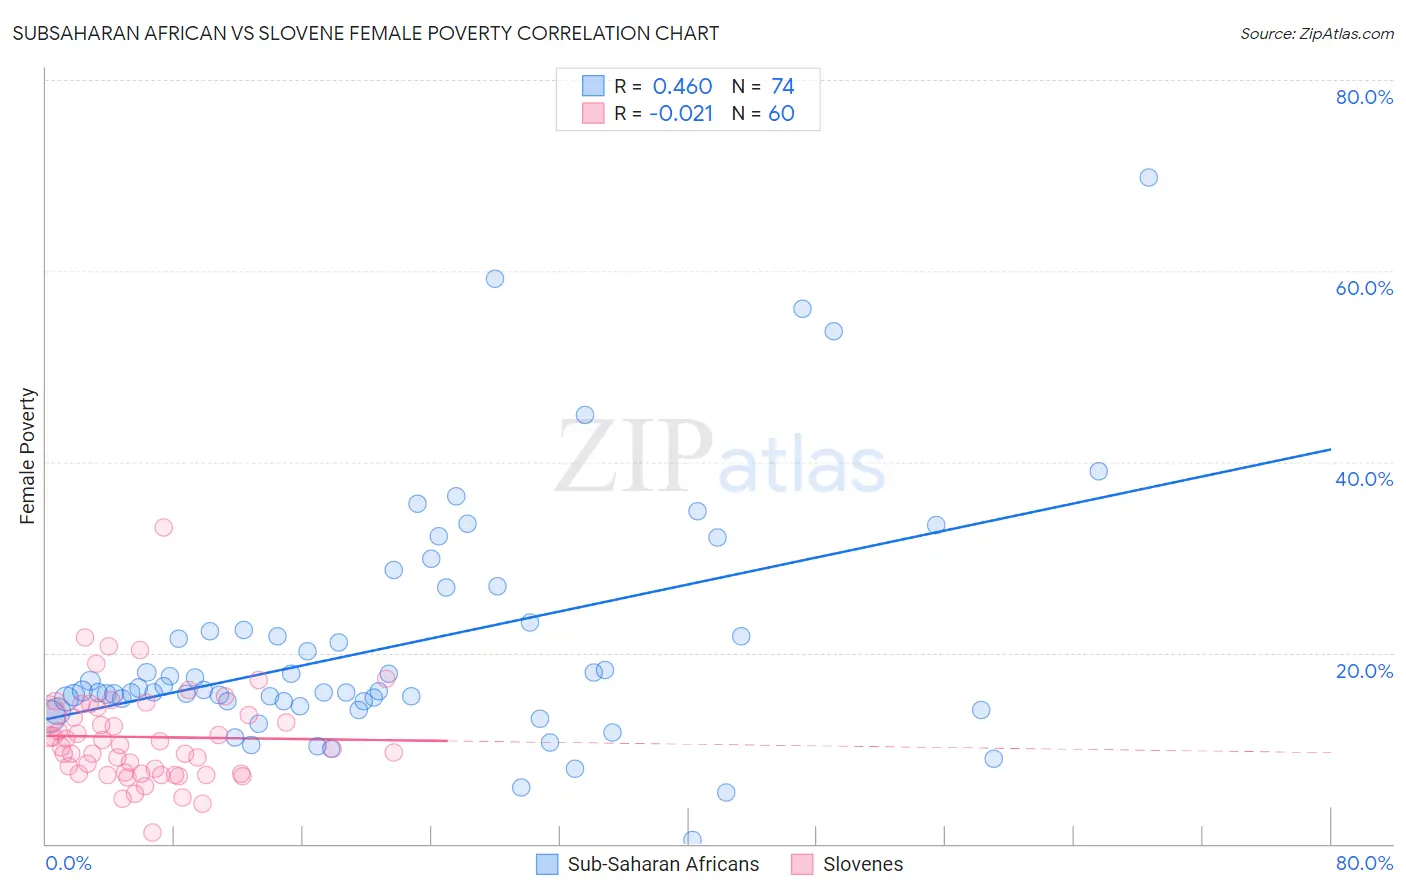
Subsaharan African vs Slovene Female Poverty Correlation Chart
The statistical analysis conducted on geographies consisting of 507,469,907 people shows a moderate positive correlation between the proportion of Sub-Saharan Africans and poverty level among females in the United States with a correlation coefficient (R) of 0.460 and weighted average of 15.8%. Similarly, the statistical analysis conducted on geographies consisting of 261,242,953 people shows no correlation between the proportion of Slovenes and poverty level among females in the United States with a correlation coefficient (R) of -0.021 and weighted average of 12.0%, a difference of 31.6%.
Female Poverty Correlation Summary
| Measurement | Subsaharan African | Slovene |
| Minimum | 0.38% | 1.2% |
| Maximum | 69.8% | 33.1% |
| Range | 69.4% | 31.9% |
| Mean | 20.8% | 11.2% |
| Median | 16.0% | 10.3% |
| Interquartile 25% (IQ1) | 14.9% | 7.3% |
| Interquartile 75% (IQ3) | 22.4% | 13.9% |
| Interquartile Range (IQR) | 7.5% | 6.6% |
| Standard Deviation (Sample) | 12.5% | 5.1% |
| Standard Deviation (Population) | 12.4% | 5.1% |
Similar Demographics by Female Poverty
Demographics Similar to Sub-Saharan Africans by Female Poverty
In terms of female poverty, the demographic groups most similar to Sub-Saharan Africans are Immigrants from Nicaragua (15.8%, a difference of 0.060%), Immigrants from El Salvador (15.7%, a difference of 0.43%), Iroquois (15.8%, a difference of 0.43%), Immigrants from Liberia (15.7%, a difference of 0.49%), and Chickasaw (15.9%, a difference of 0.69%).
| Demographics | Rating | Rank | Female Poverty |
| Immigrants | Guyana | 0.1 /100 | #260 | Tragic 15.6% |
| Guyanese | 0.1 /100 | #261 | Tragic 15.6% |
| Mexican American Indians | 0.1 /100 | #262 | Tragic 15.6% |
| Cherokee | 0.1 /100 | #263 | Tragic 15.6% |
| Immigrants | Ecuador | 0.1 /100 | #264 | Tragic 15.6% |
| Immigrants | Liberia | 0.1 /100 | #265 | Tragic 15.7% |
| Immigrants | El Salvador | 0.1 /100 | #266 | Tragic 15.7% |
| Sub-Saharan Africans | 0.1 /100 | #267 | Tragic 15.8% |
| Immigrants | Nicaragua | 0.1 /100 | #268 | Tragic 15.8% |
| Iroquois | 0.1 /100 | #269 | Tragic 15.8% |
| Chickasaw | 0.1 /100 | #270 | Tragic 15.9% |
| Immigrants | St. Vincent and the Grenadines | 0.0 /100 | #271 | Tragic 15.9% |
| Belizeans | 0.0 /100 | #272 | Tragic 15.9% |
| Haitians | 0.0 /100 | #273 | Tragic 15.9% |
| Barbadians | 0.0 /100 | #274 | Tragic 15.9% |
Demographics Similar to Slovenes by Female Poverty
In terms of female poverty, the demographic groups most similar to Slovenes are Immigrants from Romania (12.0%, a difference of 0.010%), Immigrants from Japan (11.9%, a difference of 0.20%), Immigrants from Bulgaria (12.0%, a difference of 0.22%), Asian (11.9%, a difference of 0.43%), and Immigrants from Croatia (12.0%, a difference of 0.52%).
| Demographics | Rating | Rank | Female Poverty |
| Koreans | 99.2 /100 | #43 | Exceptional 11.9% |
| Tongans | 99.2 /100 | #44 | Exceptional 11.9% |
| Immigrants | Czechoslovakia | 99.2 /100 | #45 | Exceptional 11.9% |
| Turks | 99.2 /100 | #46 | Exceptional 11.9% |
| Asians | 99.1 /100 | #47 | Exceptional 11.9% |
| Immigrants | Japan | 99.0 /100 | #48 | Exceptional 11.9% |
| Immigrants | Romania | 99.0 /100 | #49 | Exceptional 12.0% |
| Slovenes | 98.9 /100 | #50 | Exceptional 12.0% |
| Immigrants | Bulgaria | 98.9 /100 | #51 | Exceptional 12.0% |
| Immigrants | Croatia | 98.7 /100 | #52 | Exceptional 12.0% |
| Immigrants | Austria | 98.7 /100 | #53 | Exceptional 12.0% |
| Immigrants | Philippines | 98.7 /100 | #54 | Exceptional 12.1% |
| Immigrants | Sri Lanka | 98.5 /100 | #55 | Exceptional 12.1% |
| Estonians | 98.3 /100 | #56 | Exceptional 12.1% |
| Immigrants | Serbia | 98.3 /100 | #57 | Exceptional 12.1% |