Subsaharan African vs Lumbee Unemployment Among Seniors over 75 years
COMPARE
Subsaharan African
Lumbee
Unemployment Among Seniors over 75 years
Unemployment Among Seniors over 75 years Comparison
Sub-Saharan Africans
Lumbee
9.2%
UNEMPLOYMENT AMONG SENIORS OVER 75 YEARS
2.3/ 100
METRIC RATING
247th/ 347
METRIC RANK
13.5%
UNEMPLOYMENT AMONG SENIORS OVER 75 YEARS
0.0/ 100
METRIC RATING
341st/ 347
METRIC RANK
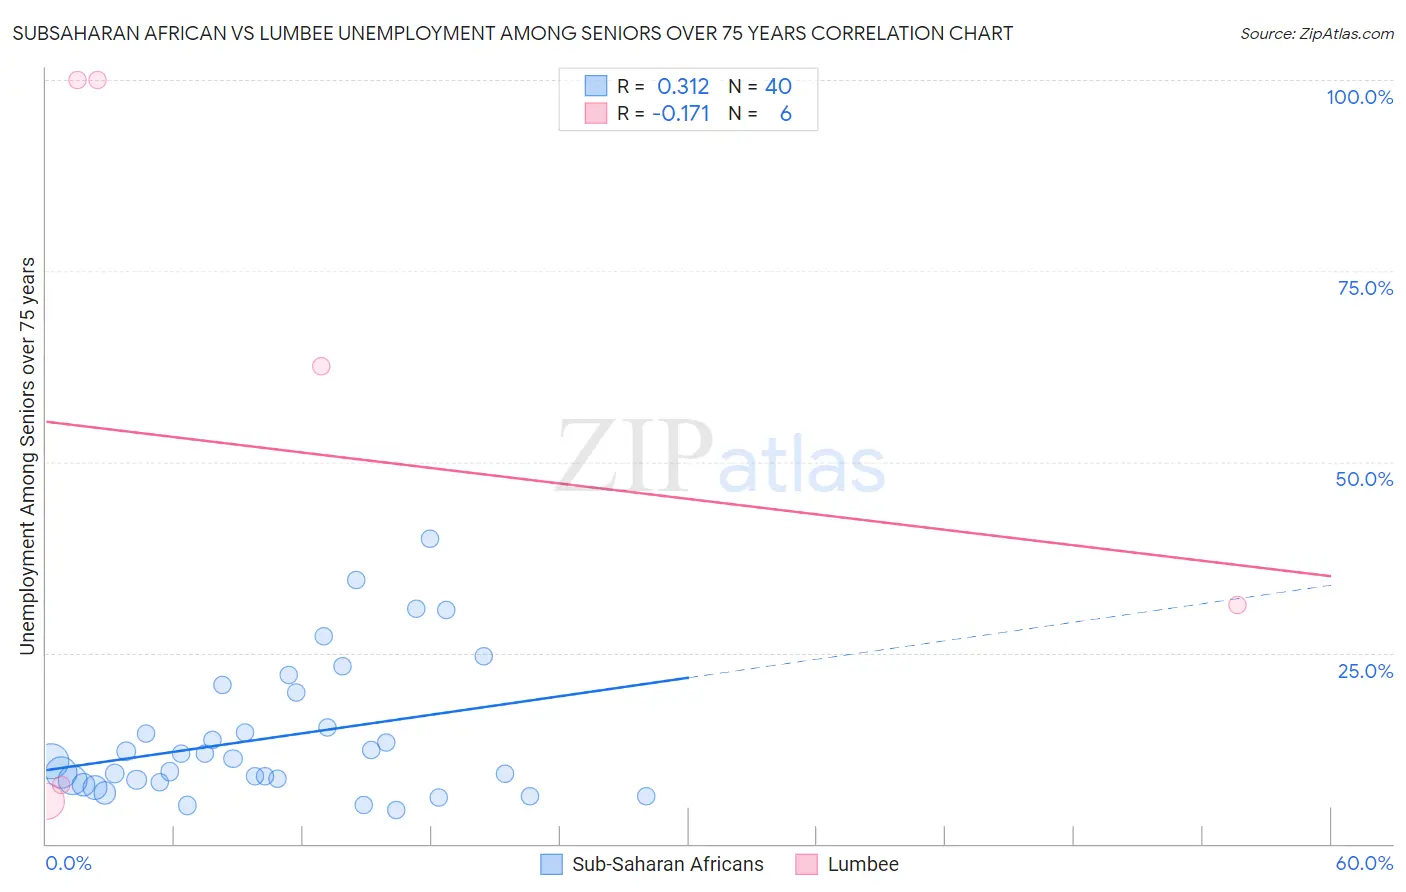
Subsaharan African vs Lumbee Unemployment Among Seniors over 75 years Correlation Chart
The statistical analysis conducted on geographies consisting of 227,990,978 people shows a mild positive correlation between the proportion of Sub-Saharan Africans and unemployment rate among seniors over the age of 75 in the United States with a correlation coefficient (R) of 0.312 and weighted average of 9.2%. Similarly, the statistical analysis conducted on geographies consisting of 65,452,608 people shows a poor negative correlation between the proportion of Lumbee and unemployment rate among seniors over the age of 75 in the United States with a correlation coefficient (R) of -0.171 and weighted average of 13.5%, a difference of 46.6%.
Unemployment Among Seniors over 75 years Correlation Summary
| Measurement | Subsaharan African | Lumbee |
| Minimum | 4.4% | 5.5% |
| Maximum | 40.0% | 100.0% |
| Range | 35.6% | 94.5% |
| Mean | 13.9% | 51.2% |
| Median | 10.9% | 46.9% |
| Interquartile 25% (IQ1) | 8.2% | 7.6% |
| Interquartile 75% (IQ3) | 17.5% | 100.0% |
| Interquartile Range (IQR) | 9.4% | 92.4% |
| Standard Deviation (Sample) | 8.8% | 43.1% |
| Standard Deviation (Population) | 8.7% | 39.3% |
Similar Demographics by Unemployment Among Seniors over 75 years
Demographics Similar to Sub-Saharan Africans by Unemployment Among Seniors over 75 years
In terms of unemployment among seniors over 75 years, the demographic groups most similar to Sub-Saharan Africans are Immigrants from North America (9.2%, a difference of 0.020%), Blackfeet (9.2%, a difference of 0.040%), Immigrants from Saudi Arabia (9.2%, a difference of 0.090%), Central American Indian (9.2%, a difference of 0.10%), and Immigrants from Canada (9.2%, a difference of 0.14%).
| Demographics | Rating | Rank | Unemployment Among Seniors over 75 years |
| Spanish | 3.3 /100 | #240 | Tragic 9.1% |
| Immigrants | Southern Europe | 2.8 /100 | #241 | Tragic 9.2% |
| Sierra Leoneans | 2.8 /100 | #242 | Tragic 9.2% |
| Slavs | 2.8 /100 | #243 | Tragic 9.2% |
| Immigrants | Germany | 2.7 /100 | #244 | Tragic 9.2% |
| Immigrants | Canada | 2.6 /100 | #245 | Tragic 9.2% |
| Immigrants | North America | 2.4 /100 | #246 | Tragic 9.2% |
| Sub-Saharan Africans | 2.3 /100 | #247 | Tragic 9.2% |
| Blackfeet | 2.3 /100 | #248 | Tragic 9.2% |
| Immigrants | Saudi Arabia | 2.2 /100 | #249 | Tragic 9.2% |
| Central American Indians | 2.2 /100 | #250 | Tragic 9.2% |
| Immigrants | Poland | 2.0 /100 | #251 | Tragic 9.2% |
| Immigrants | Sudan | 2.0 /100 | #252 | Tragic 9.2% |
| Pima | 1.8 /100 | #253 | Tragic 9.2% |
| Immigrants | Ghana | 1.7 /100 | #254 | Tragic 9.2% |
Demographics Similar to Lumbee by Unemployment Among Seniors over 75 years
In terms of unemployment among seniors over 75 years, the demographic groups most similar to Lumbee are Hmong (13.7%, a difference of 2.0%), Yup'ik (12.8%, a difference of 5.5%), Cajun (12.5%, a difference of 7.8%), Alaska Native (14.7%, a difference of 8.9%), and Immigrants from Cabo Verde (12.3%, a difference of 9.2%).
| Demographics | Rating | Rank | Unemployment Among Seniors over 75 years |
| Alaskan Athabascans | 0.0 /100 | #333 | Tragic 11.0% |
| Assyrians/Chaldeans/Syriacs | 0.0 /100 | #334 | Tragic 11.1% |
| French Canadians | 0.0 /100 | #335 | Tragic 11.2% |
| Immigrants | North Macedonia | 0.0 /100 | #336 | Tragic 11.3% |
| Cape Verdeans | 0.0 /100 | #337 | Tragic 11.4% |
| Immigrants | Cabo Verde | 0.0 /100 | #338 | Tragic 12.3% |
| Cajuns | 0.0 /100 | #339 | Tragic 12.5% |
| Yup'ik | 0.0 /100 | #340 | Tragic 12.8% |
| Lumbee | 0.0 /100 | #341 | Tragic 13.5% |
| Hmong | 0.0 /100 | #342 | Tragic 13.7% |
| Alaska Natives | 0.0 /100 | #343 | Tragic 14.7% |
| Immigrants | Yemen | 0.0 /100 | #344 | Tragic 16.5% |
| Yakama | 0.0 /100 | #345 | Tragic 18.4% |
| Tlingit-Haida | 0.0 /100 | #346 | Tragic 20.7% |