Subsaharan African vs Lumbee Births to Unmarried Women
COMPARE
Subsaharan African
Lumbee
Births to Unmarried Women
Births to Unmarried Women Comparison
Sub-Saharan Africans
Lumbee
36.7%
BIRTHS TO UNMARRIED WOMEN
0.1/ 100
METRIC RATING
264th/ 347
METRIC RANK
48.2%
BIRTHS TO UNMARRIED WOMEN
0.0/ 100
METRIC RATING
339th/ 347
METRIC RANK
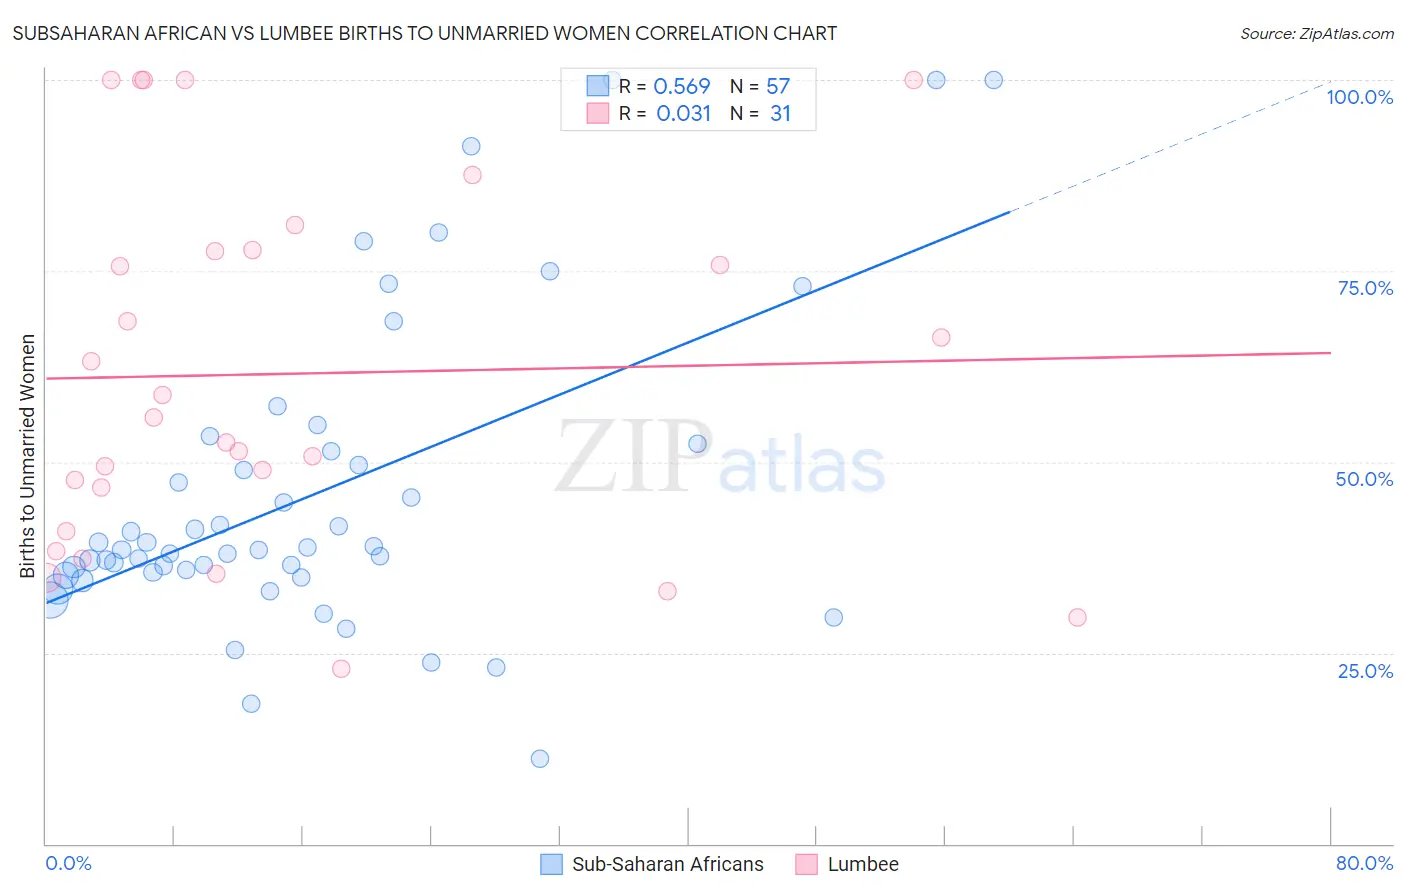
Subsaharan African vs Lumbee Births to Unmarried Women Correlation Chart
The statistical analysis conducted on geographies consisting of 468,897,335 people shows a substantial positive correlation between the proportion of Sub-Saharan Africans and percentage of births to unmarried women in the United States with a correlation coefficient (R) of 0.569 and weighted average of 36.7%. Similarly, the statistical analysis conducted on geographies consisting of 89,846,476 people shows no correlation between the proportion of Lumbee and percentage of births to unmarried women in the United States with a correlation coefficient (R) of 0.031 and weighted average of 48.2%, a difference of 31.5%.
Births to Unmarried Women Correlation Summary
| Measurement | Subsaharan African | Lumbee |
| Minimum | 11.1% | 22.9% |
| Maximum | 100.0% | 100.0% |
| Range | 88.9% | 77.1% |
| Mean | 45.9% | 61.5% |
| Median | 38.5% | 55.9% |
| Interquartile 25% (IQ1) | 35.3% | 40.9% |
| Interquartile 75% (IQ3) | 51.9% | 77.7% |
| Interquartile Range (IQR) | 16.5% | 36.8% |
| Standard Deviation (Sample) | 20.2% | 23.6% |
| Standard Deviation (Population) | 20.0% | 23.3% |
Similar Demographics by Births to Unmarried Women
Demographics Similar to Sub-Saharan Africans by Births to Unmarried Women
In terms of births to unmarried women, the demographic groups most similar to Sub-Saharan Africans are Cherokee (36.7%, a difference of 0.050%), Immigrants from Senegal (36.7%, a difference of 0.10%), Nicaraguan (36.6%, a difference of 0.12%), French American Indian (36.6%, a difference of 0.14%), and Central American (36.7%, a difference of 0.17%).
| Demographics | Rating | Rank | Births to Unmarried Women |
| Immigrants | Grenada | 0.2 /100 | #257 | Tragic 36.3% |
| Americans | 0.2 /100 | #258 | Tragic 36.4% |
| Immigrants | El Salvador | 0.2 /100 | #259 | Tragic 36.4% |
| Ottawa | 0.2 /100 | #260 | Tragic 36.5% |
| Trinidadians and Tobagonians | 0.2 /100 | #261 | Tragic 36.5% |
| French American Indians | 0.1 /100 | #262 | Tragic 36.6% |
| Nicaraguans | 0.1 /100 | #263 | Tragic 36.6% |
| Sub-Saharan Africans | 0.1 /100 | #264 | Tragic 36.7% |
| Cherokee | 0.1 /100 | #265 | Tragic 36.7% |
| Immigrants | Senegal | 0.1 /100 | #266 | Tragic 36.7% |
| Central Americans | 0.1 /100 | #267 | Tragic 36.7% |
| Comanche | 0.1 /100 | #268 | Tragic 36.7% |
| Senegalese | 0.1 /100 | #269 | Tragic 36.8% |
| Immigrants | Congo | 0.1 /100 | #270 | Tragic 36.8% |
| Immigrants | Barbados | 0.1 /100 | #271 | Tragic 36.8% |
Demographics Similar to Lumbee by Births to Unmarried Women
In terms of births to unmarried women, the demographic groups most similar to Lumbee are Arapaho (47.1%, a difference of 2.3%), Tohono O'odham (49.8%, a difference of 3.4%), Houma (46.6%, a difference of 3.5%), Hopi (50.8%, a difference of 5.4%), and Puerto Rican (45.7%, a difference of 5.5%).
| Demographics | Rating | Rank | Births to Unmarried Women |
| Kiowa | 0.0 /100 | #332 | Tragic 43.1% |
| Blacks/African Americans | 0.0 /100 | #333 | Tragic 44.3% |
| Yuman | 0.0 /100 | #334 | Tragic 44.4% |
| Colville | 0.0 /100 | #335 | Tragic 45.3% |
| Puerto Ricans | 0.0 /100 | #336 | Tragic 45.7% |
| Houma | 0.0 /100 | #337 | Tragic 46.6% |
| Arapaho | 0.0 /100 | #338 | Tragic 47.1% |
| Lumbee | 0.0 /100 | #339 | Tragic 48.2% |
| Tohono O'odham | 0.0 /100 | #340 | Tragic 49.8% |
| Hopi | 0.0 /100 | #341 | Tragic 50.8% |
| Menominee | 0.0 /100 | #342 | Tragic 51.1% |
| Pima | 0.0 /100 | #343 | Tragic 51.5% |
| Navajo | 0.0 /100 | #344 | Tragic 51.5% |
| Inupiat | 0.0 /100 | #345 | Tragic 52.1% |
| Pueblo | 0.0 /100 | #346 | Tragic 53.7% |