Subsaharan African vs Black/African American Single Female Poverty
COMPARE
Subsaharan African
Black/African American
Single Female Poverty
Single Female Poverty Comparison
Sub-Saharan Africans
Blacks/African Americans
23.2%
SINGLE FEMALE POVERTY
0.1/ 100
METRIC RATING
271st/ 347
METRIC RANK
26.4%
SINGLE FEMALE POVERTY
0.0/ 100
METRIC RATING
319th/ 347
METRIC RANK
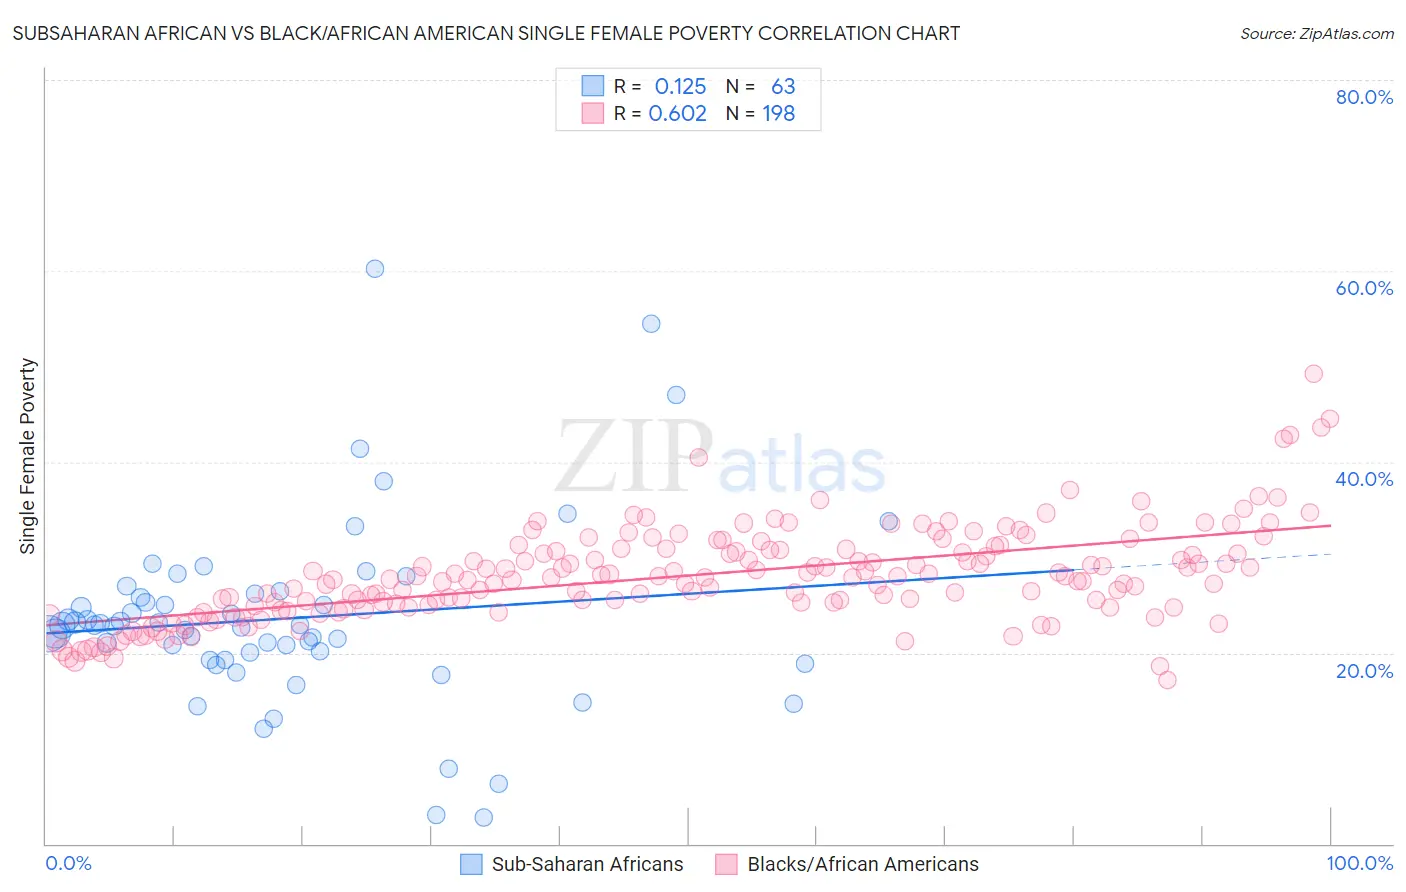
Subsaharan African vs Black/African American Single Female Poverty Correlation Chart
The statistical analysis conducted on geographies consisting of 498,393,739 people shows a poor positive correlation between the proportion of Sub-Saharan Africans and poverty level among single females in the United States with a correlation coefficient (R) of 0.125 and weighted average of 23.2%. Similarly, the statistical analysis conducted on geographies consisting of 548,844,425 people shows a significant positive correlation between the proportion of Blacks/African Americans and poverty level among single females in the United States with a correlation coefficient (R) of 0.602 and weighted average of 26.4%, a difference of 13.6%.
Single Female Poverty Correlation Summary
| Measurement | Subsaharan African | Black/African American |
| Minimum | 2.8% | 17.1% |
| Maximum | 60.3% | 49.3% |
| Range | 57.5% | 32.1% |
| Mean | 23.6% | 28.1% |
| Median | 22.9% | 27.8% |
| Interquartile 25% (IQ1) | 19.3% | 24.8% |
| Interquartile 75% (IQ3) | 26.2% | 30.8% |
| Interquartile Range (IQR) | 6.9% | 6.0% |
| Standard Deviation (Sample) | 9.9% | 5.0% |
| Standard Deviation (Population) | 9.8% | 5.0% |
Similar Demographics by Single Female Poverty
Demographics Similar to Sub-Saharan Africans by Single Female Poverty
In terms of single female poverty, the demographic groups most similar to Sub-Saharan Africans are Immigrants from Senegal (23.2%, a difference of 0.19%), Inupiat (23.1%, a difference of 0.25%), Alaska Native (23.3%, a difference of 0.44%), Marshallese (23.3%, a difference of 0.45%), and Hmong (23.1%, a difference of 0.50%).
| Demographics | Rating | Rank | Single Female Poverty |
| Immigrants | Laos | 0.3 /100 | #264 | Tragic 22.9% |
| Central Americans | 0.2 /100 | #265 | Tragic 23.0% |
| Immigrants | Micronesia | 0.2 /100 | #266 | Tragic 23.0% |
| Senegalese | 0.2 /100 | #267 | Tragic 23.0% |
| Fijians | 0.2 /100 | #268 | Tragic 23.1% |
| Hmong | 0.2 /100 | #269 | Tragic 23.1% |
| Inupiat | 0.2 /100 | #270 | Tragic 23.1% |
| Sub-Saharan Africans | 0.1 /100 | #271 | Tragic 23.2% |
| Immigrants | Senegal | 0.1 /100 | #272 | Tragic 23.2% |
| Alaska Natives | 0.1 /100 | #273 | Tragic 23.3% |
| Marshallese | 0.1 /100 | #274 | Tragic 23.3% |
| Mexican American Indians | 0.1 /100 | #275 | Tragic 23.4% |
| Immigrants | Azores | 0.0 /100 | #276 | Tragic 23.5% |
| Pennsylvania Germans | 0.0 /100 | #277 | Tragic 23.6% |
| Immigrants | Nonimmigrants | 0.0 /100 | #278 | Tragic 23.6% |
Demographics Similar to Blacks/African Americans by Single Female Poverty
In terms of single female poverty, the demographic groups most similar to Blacks/African Americans are Arapaho (26.4%, a difference of 0.30%), Chickasaw (26.3%, a difference of 0.33%), Yup'ik (26.6%, a difference of 0.95%), Ottawa (26.0%, a difference of 1.4%), and Seminole (26.8%, a difference of 1.7%).
| Demographics | Rating | Rank | Single Female Poverty |
| Paiute | 0.0 /100 | #312 | Tragic 25.5% |
| Comanche | 0.0 /100 | #313 | Tragic 25.6% |
| Cherokee | 0.0 /100 | #314 | Tragic 25.7% |
| Iroquois | 0.0 /100 | #315 | Tragic 25.7% |
| Immigrants | Somalia | 0.0 /100 | #316 | Tragic 25.8% |
| Ottawa | 0.0 /100 | #317 | Tragic 26.0% |
| Chickasaw | 0.0 /100 | #318 | Tragic 26.3% |
| Blacks/African Americans | 0.0 /100 | #319 | Tragic 26.4% |
| Arapaho | 0.0 /100 | #320 | Tragic 26.4% |
| Yup'ik | 0.0 /100 | #321 | Tragic 26.6% |
| Seminole | 0.0 /100 | #322 | Tragic 26.8% |
| Chippewa | 0.0 /100 | #323 | Tragic 26.8% |
| Kiowa | 0.0 /100 | #324 | Tragic 26.9% |
| Choctaw | 0.0 /100 | #325 | Tragic 27.2% |
| Creek | 0.0 /100 | #326 | Tragic 27.4% |