Subsaharan African vs Trinidadian and Tobagonian Single Female Poverty
COMPARE
Subsaharan African
Trinidadian and Tobagonian
Single Female Poverty
Single Female Poverty Comparison
Sub-Saharan Africans
Trinidadians and Tobagonians
23.2%
SINGLE FEMALE POVERTY
0.1/ 100
METRIC RATING
271st/ 347
METRIC RANK
21.2%
SINGLE FEMALE POVERTY
35.2/ 100
METRIC RATING
190th/ 347
METRIC RANK
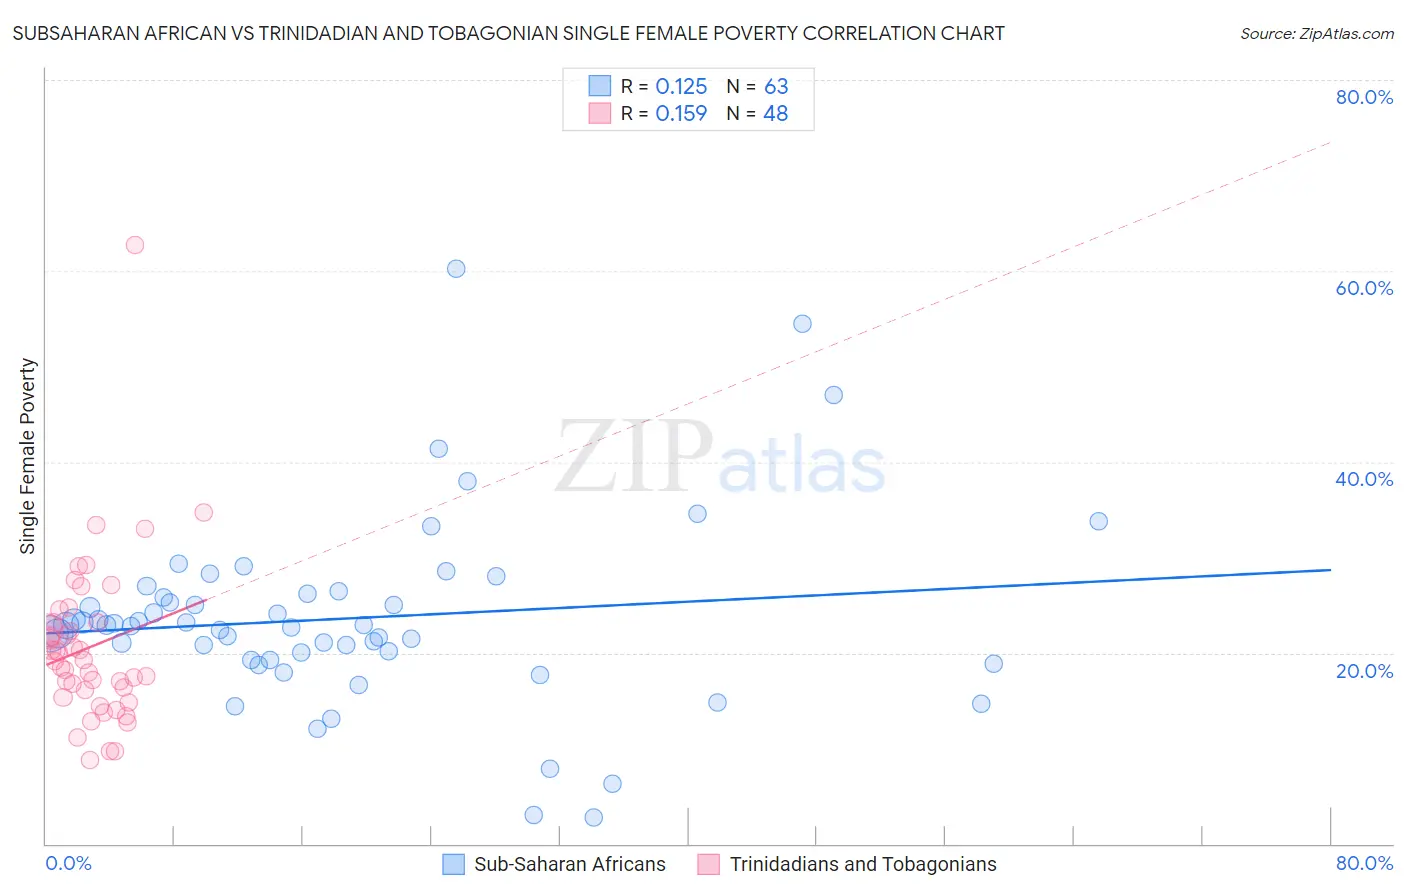
Subsaharan African vs Trinidadian and Tobagonian Single Female Poverty Correlation Chart
The statistical analysis conducted on geographies consisting of 498,393,739 people shows a poor positive correlation between the proportion of Sub-Saharan Africans and poverty level among single females in the United States with a correlation coefficient (R) of 0.125 and weighted average of 23.2%. Similarly, the statistical analysis conducted on geographies consisting of 217,955,182 people shows a poor positive correlation between the proportion of Trinidadians and Tobagonians and poverty level among single females in the United States with a correlation coefficient (R) of 0.159 and weighted average of 21.2%, a difference of 9.3%.
Single Female Poverty Correlation Summary
| Measurement | Subsaharan African | Trinidadian and Tobagonian |
| Minimum | 2.8% | 8.8% |
| Maximum | 60.3% | 62.7% |
| Range | 57.5% | 53.9% |
| Mean | 23.6% | 20.6% |
| Median | 22.9% | 19.2% |
| Interquartile 25% (IQ1) | 19.3% | 15.7% |
| Interquartile 75% (IQ3) | 26.2% | 23.2% |
| Interquartile Range (IQR) | 6.9% | 7.5% |
| Standard Deviation (Sample) | 9.9% | 8.7% |
| Standard Deviation (Population) | 9.8% | 8.6% |
Similar Demographics by Single Female Poverty
Demographics Similar to Sub-Saharan Africans by Single Female Poverty
In terms of single female poverty, the demographic groups most similar to Sub-Saharan Africans are Immigrants from Senegal (23.2%, a difference of 0.19%), Inupiat (23.1%, a difference of 0.25%), Alaska Native (23.3%, a difference of 0.44%), Marshallese (23.3%, a difference of 0.45%), and Hmong (23.1%, a difference of 0.50%).
| Demographics | Rating | Rank | Single Female Poverty |
| Immigrants | Laos | 0.3 /100 | #264 | Tragic 22.9% |
| Central Americans | 0.2 /100 | #265 | Tragic 23.0% |
| Immigrants | Micronesia | 0.2 /100 | #266 | Tragic 23.0% |
| Senegalese | 0.2 /100 | #267 | Tragic 23.0% |
| Fijians | 0.2 /100 | #268 | Tragic 23.1% |
| Hmong | 0.2 /100 | #269 | Tragic 23.1% |
| Inupiat | 0.2 /100 | #270 | Tragic 23.1% |
| Sub-Saharan Africans | 0.1 /100 | #271 | Tragic 23.2% |
| Immigrants | Senegal | 0.1 /100 | #272 | Tragic 23.2% |
| Alaska Natives | 0.1 /100 | #273 | Tragic 23.3% |
| Marshallese | 0.1 /100 | #274 | Tragic 23.3% |
| Mexican American Indians | 0.1 /100 | #275 | Tragic 23.4% |
| Immigrants | Azores | 0.0 /100 | #276 | Tragic 23.5% |
| Pennsylvania Germans | 0.0 /100 | #277 | Tragic 23.6% |
| Immigrants | Nonimmigrants | 0.0 /100 | #278 | Tragic 23.6% |
Demographics Similar to Trinidadians and Tobagonians by Single Female Poverty
In terms of single female poverty, the demographic groups most similar to Trinidadians and Tobagonians are Immigrants from Cuba (21.2%, a difference of 0.0%), Yugoslavian (21.2%, a difference of 0.010%), Immigrants from Nigeria (21.2%, a difference of 0.10%), Hawaiian (21.2%, a difference of 0.16%), and Immigrants from Cambodia (21.2%, a difference of 0.20%).
| Demographics | Rating | Rank | Single Female Poverty |
| Slovaks | 39.7 /100 | #183 | Fair 21.1% |
| Hungarians | 39.6 /100 | #184 | Fair 21.1% |
| Immigrants | Cambodia | 38.2 /100 | #185 | Fair 21.2% |
| Hawaiians | 37.7 /100 | #186 | Fair 21.2% |
| Immigrants | Nigeria | 36.8 /100 | #187 | Fair 21.2% |
| Yugoslavians | 35.4 /100 | #188 | Fair 21.2% |
| Immigrants | Cuba | 35.3 /100 | #189 | Fair 21.2% |
| Trinidadians and Tobagonians | 35.2 /100 | #190 | Fair 21.2% |
| Immigrants | Germany | 31.1 /100 | #191 | Fair 21.3% |
| Immigrants | Jamaica | 30.5 /100 | #192 | Fair 21.3% |
| Basques | 28.1 /100 | #193 | Fair 21.3% |
| Czechoslovakians | 27.7 /100 | #194 | Fair 21.3% |
| Nicaraguans | 27.6 /100 | #195 | Fair 21.3% |
| Immigrants | Saudi Arabia | 27.1 /100 | #196 | Fair 21.3% |
| Japanese | 26.4 /100 | #197 | Fair 21.3% |