Immigrants from Austria vs Black/African American Single Female Poverty
COMPARE
Immigrants from Austria
Black/African American
Single Female Poverty
Single Female Poverty Comparison
Immigrants from Austria
Blacks/African Americans
19.6%
SINGLE FEMALE POVERTY
98.8/ 100
METRIC RATING
93rd/ 347
METRIC RANK
26.4%
SINGLE FEMALE POVERTY
0.0/ 100
METRIC RATING
319th/ 347
METRIC RANK
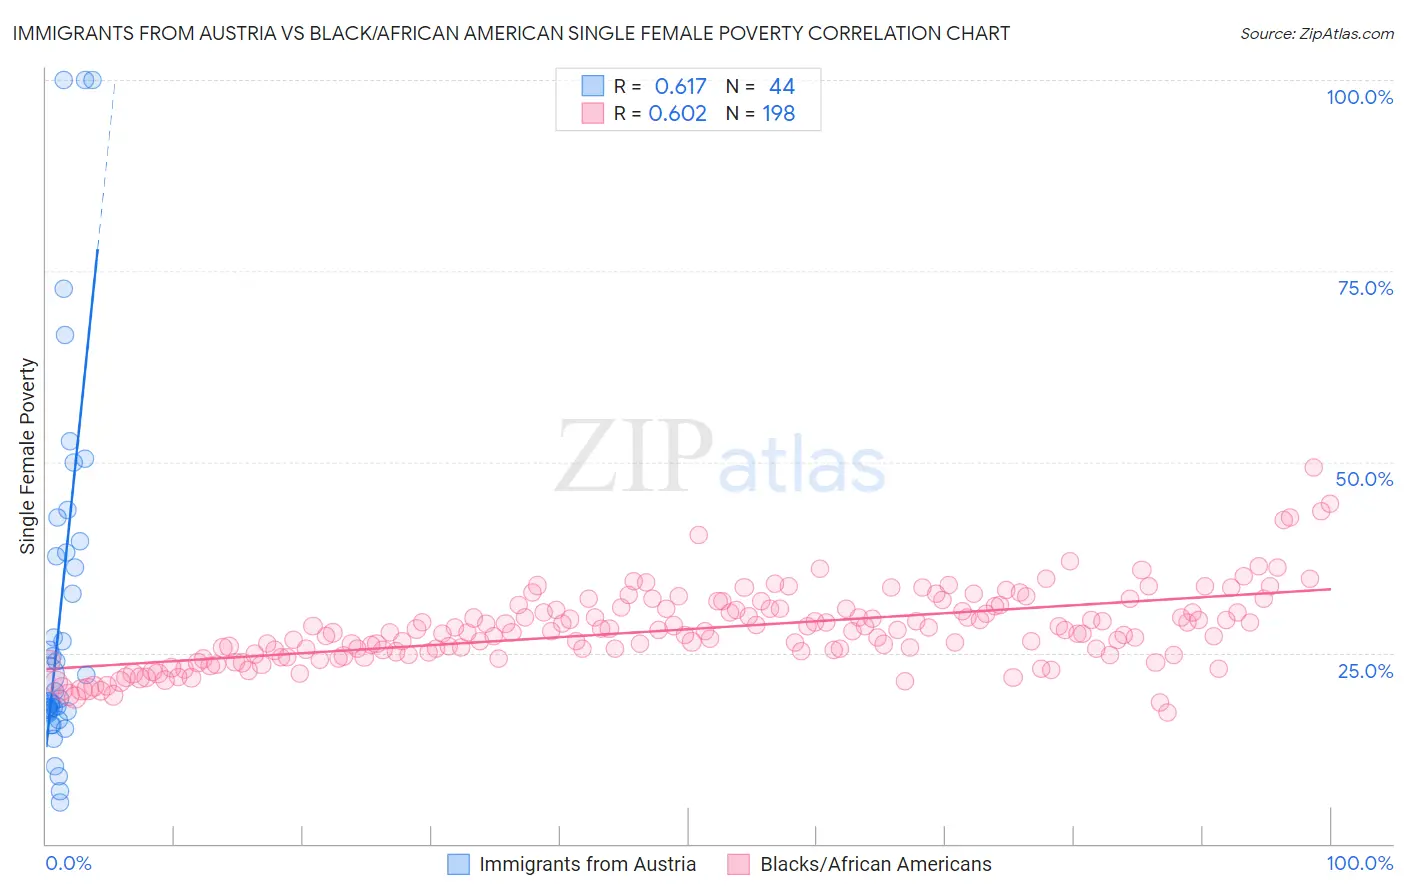
Immigrants from Austria vs Black/African American Single Female Poverty Correlation Chart
The statistical analysis conducted on geographies consisting of 166,235,913 people shows a significant positive correlation between the proportion of Immigrants from Austria and poverty level among single females in the United States with a correlation coefficient (R) of 0.617 and weighted average of 19.6%. Similarly, the statistical analysis conducted on geographies consisting of 548,844,425 people shows a significant positive correlation between the proportion of Blacks/African Americans and poverty level among single females in the United States with a correlation coefficient (R) of 0.602 and weighted average of 26.4%, a difference of 34.6%.
Single Female Poverty Correlation Summary
| Measurement | Immigrants from Austria | Black/African American |
| Minimum | 5.5% | 17.1% |
| Maximum | 100.0% | 49.3% |
| Range | 94.5% | 32.1% |
| Mean | 31.3% | 28.1% |
| Median | 21.0% | 27.8% |
| Interquartile 25% (IQ1) | 17.4% | 24.8% |
| Interquartile 75% (IQ3) | 38.9% | 30.8% |
| Interquartile Range (IQR) | 21.4% | 6.0% |
| Standard Deviation (Sample) | 24.1% | 5.0% |
| Standard Deviation (Population) | 23.8% | 5.0% |
Similar Demographics by Single Female Poverty
Demographics Similar to Immigrants from Austria by Single Female Poverty
In terms of single female poverty, the demographic groups most similar to Immigrants from Austria are Italian (19.6%, a difference of 0.010%), Soviet Union (19.6%, a difference of 0.060%), Immigrants from Lebanon (19.6%, a difference of 0.12%), Romanian (19.6%, a difference of 0.22%), and Immigrants from Ukraine (19.5%, a difference of 0.30%).
| Demographics | Rating | Rank | Single Female Poverty |
| Greeks | 99.2 /100 | #86 | Exceptional 19.4% |
| Zimbabweans | 99.0 /100 | #87 | Exceptional 19.5% |
| Afghans | 99.0 /100 | #88 | Exceptional 19.5% |
| Immigrants | Ukraine | 99.0 /100 | #89 | Exceptional 19.5% |
| Immigrants | Lebanon | 98.8 /100 | #90 | Exceptional 19.6% |
| Soviet Union | 98.8 /100 | #91 | Exceptional 19.6% |
| Italians | 98.8 /100 | #92 | Exceptional 19.6% |
| Immigrants | Austria | 98.8 /100 | #93 | Exceptional 19.6% |
| Romanians | 98.6 /100 | #94 | Exceptional 19.6% |
| Estonians | 98.2 /100 | #95 | Exceptional 19.7% |
| Immigrants | Brazil | 98.2 /100 | #96 | Exceptional 19.7% |
| Croatians | 98.1 /100 | #97 | Exceptional 19.7% |
| Immigrants | France | 97.9 /100 | #98 | Exceptional 19.7% |
| Sierra Leoneans | 97.9 /100 | #99 | Exceptional 19.7% |
| Ukrainians | 97.6 /100 | #100 | Exceptional 19.8% |
Demographics Similar to Blacks/African Americans by Single Female Poverty
In terms of single female poverty, the demographic groups most similar to Blacks/African Americans are Arapaho (26.4%, a difference of 0.30%), Chickasaw (26.3%, a difference of 0.33%), Yup'ik (26.6%, a difference of 0.95%), Ottawa (26.0%, a difference of 1.4%), and Seminole (26.8%, a difference of 1.7%).
| Demographics | Rating | Rank | Single Female Poverty |
| Paiute | 0.0 /100 | #312 | Tragic 25.5% |
| Comanche | 0.0 /100 | #313 | Tragic 25.6% |
| Cherokee | 0.0 /100 | #314 | Tragic 25.7% |
| Iroquois | 0.0 /100 | #315 | Tragic 25.7% |
| Immigrants | Somalia | 0.0 /100 | #316 | Tragic 25.8% |
| Ottawa | 0.0 /100 | #317 | Tragic 26.0% |
| Chickasaw | 0.0 /100 | #318 | Tragic 26.3% |
| Blacks/African Americans | 0.0 /100 | #319 | Tragic 26.4% |
| Arapaho | 0.0 /100 | #320 | Tragic 26.4% |
| Yup'ik | 0.0 /100 | #321 | Tragic 26.6% |
| Seminole | 0.0 /100 | #322 | Tragic 26.8% |
| Chippewa | 0.0 /100 | #323 | Tragic 26.8% |
| Kiowa | 0.0 /100 | #324 | Tragic 26.9% |
| Choctaw | 0.0 /100 | #325 | Tragic 27.2% |
| Creek | 0.0 /100 | #326 | Tragic 27.4% |