Subsaharan African vs Immigrants from Scotland Single Female Poverty
COMPARE
Subsaharan African
Immigrants from Scotland
Single Female Poverty
Single Female Poverty Comparison
Sub-Saharan Africans
Immigrants from Scotland
23.2%
SINGLE FEMALE POVERTY
0.1/ 100
METRIC RATING
271st/ 347
METRIC RANK
19.4%
SINGLE FEMALE POVERTY
99.2/ 100
METRIC RATING
81st/ 347
METRIC RANK
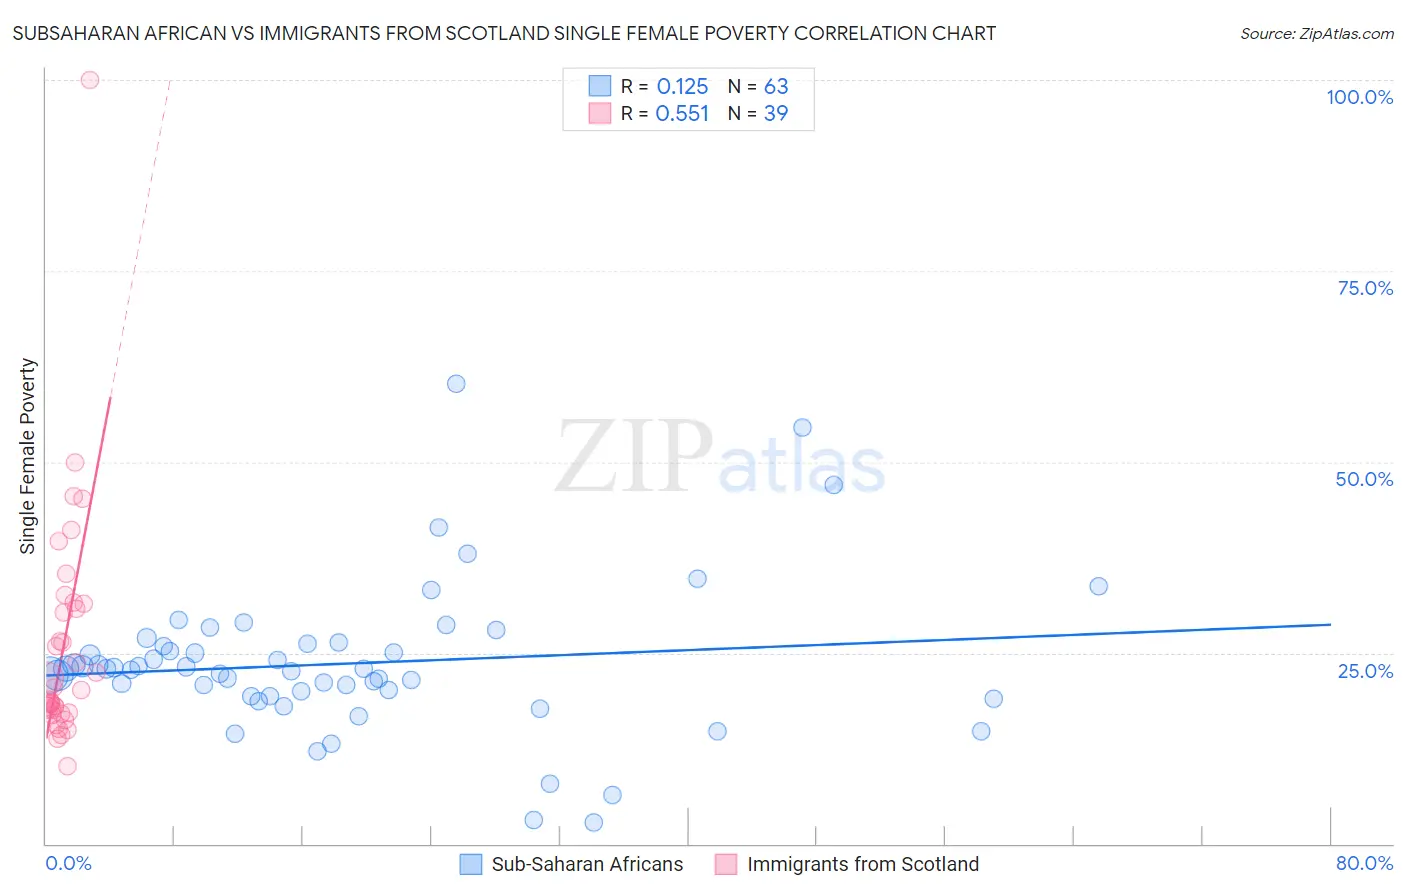
Subsaharan African vs Immigrants from Scotland Single Female Poverty Correlation Chart
The statistical analysis conducted on geographies consisting of 498,393,739 people shows a poor positive correlation between the proportion of Sub-Saharan Africans and poverty level among single females in the United States with a correlation coefficient (R) of 0.125 and weighted average of 23.2%. Similarly, the statistical analysis conducted on geographies consisting of 194,087,969 people shows a substantial positive correlation between the proportion of Immigrants from Scotland and poverty level among single females in the United States with a correlation coefficient (R) of 0.551 and weighted average of 19.4%, a difference of 19.4%.
Single Female Poverty Correlation Summary
| Measurement | Subsaharan African | Immigrants from Scotland |
| Minimum | 2.8% | 10.1% |
| Maximum | 60.3% | 100.0% |
| Range | 57.5% | 89.9% |
| Mean | 23.6% | 26.0% |
| Median | 22.9% | 20.2% |
| Interquartile 25% (IQ1) | 19.3% | 17.1% |
| Interquartile 75% (IQ3) | 26.2% | 31.4% |
| Interquartile Range (IQR) | 6.9% | 14.3% |
| Standard Deviation (Sample) | 9.9% | 15.7% |
| Standard Deviation (Population) | 9.8% | 15.5% |
Similar Demographics by Single Female Poverty
Demographics Similar to Sub-Saharan Africans by Single Female Poverty
In terms of single female poverty, the demographic groups most similar to Sub-Saharan Africans are Immigrants from Senegal (23.2%, a difference of 0.19%), Inupiat (23.1%, a difference of 0.25%), Alaska Native (23.3%, a difference of 0.44%), Marshallese (23.3%, a difference of 0.45%), and Hmong (23.1%, a difference of 0.50%).
| Demographics | Rating | Rank | Single Female Poverty |
| Immigrants | Laos | 0.3 /100 | #264 | Tragic 22.9% |
| Central Americans | 0.2 /100 | #265 | Tragic 23.0% |
| Immigrants | Micronesia | 0.2 /100 | #266 | Tragic 23.0% |
| Senegalese | 0.2 /100 | #267 | Tragic 23.0% |
| Fijians | 0.2 /100 | #268 | Tragic 23.1% |
| Hmong | 0.2 /100 | #269 | Tragic 23.1% |
| Inupiat | 0.2 /100 | #270 | Tragic 23.1% |
| Sub-Saharan Africans | 0.1 /100 | #271 | Tragic 23.2% |
| Immigrants | Senegal | 0.1 /100 | #272 | Tragic 23.2% |
| Alaska Natives | 0.1 /100 | #273 | Tragic 23.3% |
| Marshallese | 0.1 /100 | #274 | Tragic 23.3% |
| Mexican American Indians | 0.1 /100 | #275 | Tragic 23.4% |
| Immigrants | Azores | 0.0 /100 | #276 | Tragic 23.5% |
| Pennsylvania Germans | 0.0 /100 | #277 | Tragic 23.6% |
| Immigrants | Nonimmigrants | 0.0 /100 | #278 | Tragic 23.6% |
Demographics Similar to Immigrants from Scotland by Single Female Poverty
In terms of single female poverty, the demographic groups most similar to Immigrants from Scotland are Immigrants from Malaysia (19.4%, a difference of 0.010%), Immigrants from Australia (19.4%, a difference of 0.020%), Taiwanese (19.4%, a difference of 0.020%), Immigrants from Sierra Leone (19.4%, a difference of 0.060%), and Albanian (19.4%, a difference of 0.080%).
| Demographics | Rating | Rank | Single Female Poverty |
| Immigrants | Belarus | 99.4 /100 | #74 | Exceptional 19.3% |
| Immigrants | Turkey | 99.4 /100 | #75 | Exceptional 19.4% |
| Peruvians | 99.4 /100 | #76 | Exceptional 19.4% |
| Immigrants | Russia | 99.3 /100 | #77 | Exceptional 19.4% |
| Albanians | 99.3 /100 | #78 | Exceptional 19.4% |
| Immigrants | Sierra Leone | 99.3 /100 | #79 | Exceptional 19.4% |
| Immigrants | Australia | 99.3 /100 | #80 | Exceptional 19.4% |
| Immigrants | Scotland | 99.2 /100 | #81 | Exceptional 19.4% |
| Immigrants | Malaysia | 99.2 /100 | #82 | Exceptional 19.4% |
| Taiwanese | 99.2 /100 | #83 | Exceptional 19.4% |
| Immigrants | Sweden | 99.2 /100 | #84 | Exceptional 19.4% |
| Immigrants | Albania | 99.2 /100 | #85 | Exceptional 19.4% |
| Greeks | 99.2 /100 | #86 | Exceptional 19.4% |
| Zimbabweans | 99.0 /100 | #87 | Exceptional 19.5% |
| Afghans | 99.0 /100 | #88 | Exceptional 19.5% |