Subsaharan African vs Immigrants from Venezuela Single Female Poverty

COMPARE

Subsaharan African
Race
Ancestry
AfghanAfricanAlaska NativeAlaskan AthabascanAlbanianAleutAlsatianAmericanApacheArabArapahoArgentineanArmenianAssyrian/Chaldean/SyriacAustralianAustrianBahamianBangladeshiBarbadianBasqueBelgianBelizeanBermudanBhutaneseBlackfeetBolivianBrazilianBritishBritish West IndianBulgarianBurmeseCajunCambodianCanadianCape VerdeanCarpatho RusynCelticCentral AmericanCentral American IndianCherokeeCheyenneChickasawChileanChineseChippewaChoctawColombianColvilleComancheCosta RicanCreeCreekCroatianCrowCubanCypriotCzechCzechoslovakianDanishDelawareDominicanDutchDutch West IndianEastern EuropeanEcuadorianEgyptianEnglishEstonianEthiopianEuropeanFijianFilipinoFinnishFrenchFrench American IndianFrench CanadianGermanGerman RussianGhanaianGreekGuamanian/ChamorroGuatemalanGuyaneseHaitianHmongHonduranHopiHoumaHungarianIcelanderIndian (Asian)IndonesianInupiatIranianIraqiIrishIroquoisIsraeliItalianJamaicanJapaneseJordanianKenyanKiowaKoreanLaotianLatvianLebaneseLiberianLithuanianLumbeeLuxembourgerMacedonianMalaysianMalteseMarshalleseMenomineeMexicanMexican American IndianMongolianMoroccanNative HawaiianNavajoNepaleseNew ZealanderNicaraguanNigerianNorthern EuropeanNorwegianOkinawanOsageOttawaPaiutePakistaniPalestinianPanamanianParaguayanPennsylvania GermanPeruvianPimaPolishPortuguesePotawatomiPuebloPuerto RicanPuget Sound SalishRomanianRussianSalvadoranSamoanScandinavianScotch-IrishScottishSeminoleSenegaleseSerbianShoshoneSierra LeoneanSiouxSlavicSlovakSloveneSomaliSouth AfricanSouth AmericanSouth American IndianSoviet UnionSpaniardSpanishSpanish AmericanSpanish American IndianSri LankanSubsaharan AfricanSudaneseSwedishSwissSyrianTaiwaneseThaiTlingit-HaidaTohono O'OdhamTonganTrinidadian and TobagonianTsimshianTurkishU.S. Virgin IslanderUgandanUkrainianUruguayanUteVenezuelanVietnameseWelshWest IndianYakamaYaquiYugoslavianYumanYup'ikZimbabwean
Immigration
NonimmigrantsImmigrantsAfghanistanAfricaAlbaniaArgentinaArmeniaAsiaAustraliaAustriaBahamasBangladeshBarbadosBelarusBelgiumBelizeBoliviaBosnia and HerzegovinaBrazilBulgariaBurma/MyanmarCabo VerdeCambodiaCameroonCanadaCaribbeanCentral AmericaChileChinaColombiaCongoCosta RicaCroatiaCubaCzechoslovakiaDenmarkDominicaDominican RepublicEastern AfricaEastern AsiaEastern EuropeEcuadorEgyptEl SalvadorEnglandEritreaEthiopiaEuropeFijiFranceGermanyGhanaGreeceGrenadaGuatemalaGuyanaHaitiHondurasHong KongHungaryIndiaIndonesiaIranIraqIrelandIsraelItalyJamaicaJapanJordanKazakhstanKenyaKoreaKuwaitLaosLatin AmericaLatviaLebanonLiberiaLithuaniaMalaysiaMexicoMicronesiaMiddle AfricaMoldovaMoroccoNepalNetherlandsNicaraguaNigeriaNorth AmericaNorth MacedoniaNorthern AfricaNorthern EuropeNorwayOceaniaPakistanPanamaPeruPhilippinesPolandPortugalRomaniaRussiaSaudi ArabiaScotlandSenegalSerbiaSierra LeoneSingaporeSomaliaSouth AfricaSouth AmericaSouth Central AsiaSouth Eastern AsiaSouthern EuropeSpainSri LankaSt. Vincent and the GrenadinesSudanSwedenSwitzerlandSyriaTaiwanThailandTrinidad and TobagoTurkeyUgandaUkraineUruguayUzbekistanVietnamWest IndiesWestern AfricaWestern AsiaWestern EuropeYemenZaireZimbabweAzores
Immigrants from Venezuela
Race
Ancestry
AfghanAfricanAlaska NativeAlaskan AthabascanAlbanianAleutAlsatianAmericanApacheArabArapahoArgentineanArmenianAssyrian/Chaldean/SyriacAustralianAustrianBahamianBangladeshiBarbadianBasqueBelgianBelizeanBermudanBhutaneseBlackfeetBolivianBrazilianBritishBritish West IndianBulgarianBurmeseCajunCambodianCanadianCape VerdeanCarpatho RusynCelticCentral AmericanCentral American IndianCherokeeCheyenneChickasawChileanChineseChippewaChoctawColombianColvilleComancheCosta RicanCreeCreekCroatianCrowCubanCypriotCzechCzechoslovakianDanishDelawareDominicanDutchDutch West IndianEastern EuropeanEcuadorianEgyptianEnglishEstonianEthiopianEuropeanFijianFilipinoFinnishFrenchFrench American IndianFrench CanadianGermanGerman RussianGhanaianGreekGuamanian/ChamorroGuatemalanGuyaneseHaitianHmongHonduranHopiHoumaHungarianIcelanderIndian (Asian)IndonesianInupiatIranianIraqiIrishIroquoisIsraeliItalianJamaicanJapaneseJordanianKenyanKiowaKoreanLaotianLatvianLebaneseLiberianLithuanianLumbeeLuxembourgerMacedonianMalaysianMalteseMarshalleseMenomineeMexicanMexican American IndianMongolianMoroccanNative HawaiianNavajoNepaleseNew ZealanderNicaraguanNigerianNorthern EuropeanNorwegianOkinawanOsageOttawaPaiutePakistaniPalestinianPanamanianParaguayanPennsylvania GermanPeruvianPimaPolishPortuguesePotawatomiPuebloPuerto RicanPuget Sound SalishRomanianRussianSalvadoranSamoanScandinavianScotch-IrishScottishSeminoleSenegaleseSerbianShoshoneSierra LeoneanSiouxSlavicSlovakSloveneSomaliSouth AfricanSouth AmericanSouth American IndianSoviet UnionSpaniardSpanishSpanish AmericanSpanish American IndianSri LankanSudaneseSwedishSwissSyrianTaiwaneseThaiTlingit-HaidaTohono O'OdhamTonganTrinidadian and TobagonianTsimshianTurkishU.S. Virgin IslanderUgandanUkrainianUruguayanUteVenezuelanVietnameseWelshWest IndianYakamaYaquiYugoslavianYumanYup'ikZimbabwean
Immigration
NonimmigrantsImmigrantsAfghanistanAfricaAlbaniaArgentinaArmeniaAsiaAustraliaAustriaBahamasBangladeshBarbadosBelarusBelgiumBelizeBoliviaBosnia and HerzegovinaBrazilBulgariaBurma/MyanmarCabo VerdeCambodiaCameroonCanadaCaribbeanCentral AmericaChileChinaColombiaCongoCosta RicaCroatiaCubaCzechoslovakiaDenmarkDominicaDominican RepublicEastern AfricaEastern AsiaEastern EuropeEcuadorEgyptEl SalvadorEnglandEritreaEthiopiaEuropeFijiFranceGermanyGhanaGreeceGrenadaGuatemalaGuyanaHaitiHondurasHong KongHungaryIndiaIndonesiaIranIraqIrelandIsraelItalyJamaicaJapanJordanKazakhstanKenyaKoreaKuwaitLaosLatin AmericaLatviaLebanonLiberiaLithuaniaMalaysiaMexicoMicronesiaMiddle AfricaMoldovaMoroccoNepalNetherlandsNicaraguaNigeriaNorth AmericaNorth MacedoniaNorthern AfricaNorthern EuropeNorwayOceaniaPakistanPanamaPeruPhilippinesPolandPortugalRomaniaRussiaSaudi ArabiaScotlandSenegalSerbiaSierra LeoneSingaporeSomaliaSouth AfricaSouth AmericaSouth Central AsiaSouth Eastern AsiaSouthern EuropeSpainSri LankaSt. Vincent and the GrenadinesSudanSwedenSwitzerlandSyriaTaiwanThailandTrinidad and TobagoTurkeyUgandaUkraineUruguayUzbekistanVenezuelaVietnamWest IndiesWestern AfricaWestern AsiaWestern EuropeYemenZaireZimbabweAzores
Single Female Poverty
Income
Poverty
Unemployment
Labor Participation
Family Structure
Vehicle Availability
Education Level
Disability

Single Female Poverty Comparison

Sub-Saharan Africans

Immigrants from Venezuela

Tragic
Exceptional
23.2%
SINGLE FEMALE POVERTY
0.1/ 100
METRIC RATING
271st/ 347
METRIC RANK
20.2%
SINGLE FEMALE POVERTY
91.5/ 100
METRIC RATING
134th/ 347
METRIC RANK

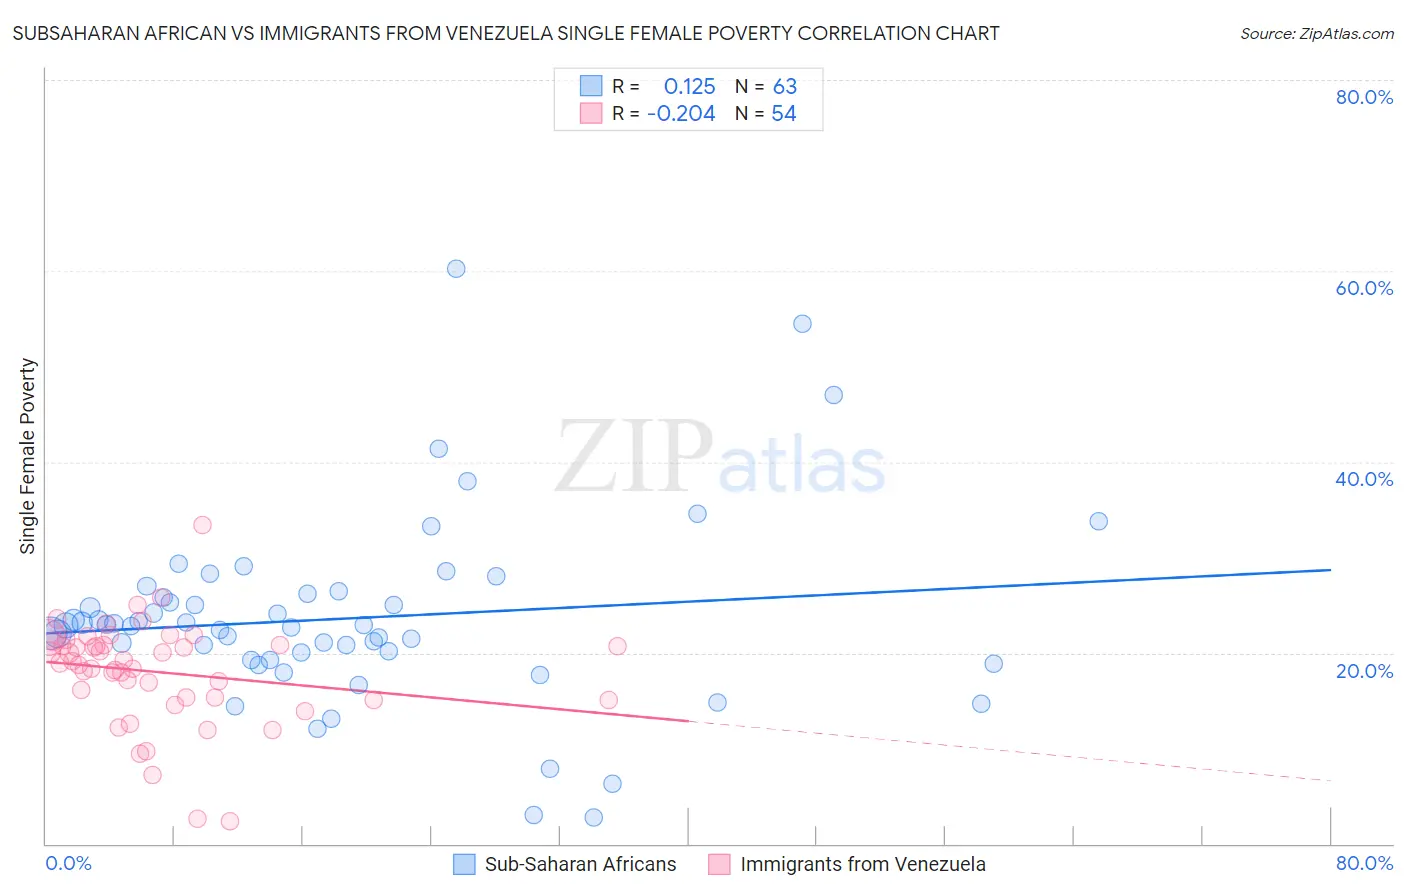
Subsaharan African vs Immigrants from Venezuela Single Female Poverty Correlation Chart

The statistical analysis conducted on geographies consisting of 498,393,739 people shows a poor positive correlation between the proportion of Sub-Saharan Africans and poverty level among single females in the United States with a correlation coefficient (R) of 0.125 and weighted average of 23.2%. Similarly, the statistical analysis conducted on geographies consisting of 285,137,962 people shows a weak negative correlation between the proportion of Immigrants from Venezuela and poverty level among single females in the United States with a correlation coefficient (R) of -0.204 and weighted average of 20.2%, a difference of 14.6%.
Subsaharan African vs Immigrants from Venezuela Single Female Poverty

Single Female Poverty Correlation Summary

MeasurementSubsaharan AfricanImmigrants from Venezuela
Minimum2.8%2.3%
Maximum60.3%33.4%
Range57.5%31.0%
Mean23.6%18.0%
Median22.9%19.0%
Interquartile 25% (IQ1)19.3%15.3%
Interquartile 75% (IQ3)26.2%20.8%
Interquartile Range (IQR)6.9%5.5%
Standard Deviation (Sample)9.9%5.4%
Standard Deviation (Population)9.8%5.4%

Similar Demographics by Single Female Poverty

Demographics Similar to Sub-Saharan Africans by Single Female Poverty

In terms of single female poverty, the demographic groups most similar to Sub-Saharan Africans are Immigrants from Senegal (23.2%, a difference of 0.19%), Inupiat (23.1%, a difference of 0.25%), Alaska Native (23.3%, a difference of 0.44%), Marshallese (23.3%, a difference of 0.45%), and Hmong (23.1%, a difference of 0.50%).
DemographicsRating | RankSingle Female Poverty
Immigrants | Laos
0.3
/100
|
#264
Tragic
22.9%
Central Americans
0.2
/100
|
#265
Tragic
23.0%
Immigrants | Micronesia
0.2
/100
|
#266
Tragic
23.0%
Senegalese
0.2
/100
|
#267
Tragic
23.0%
Fijians
0.2
/100
|
#268
Tragic
23.1%
Hmong
0.2
/100
|
#269
Tragic
23.1%
Inupiat
0.2
/100
|
#270
Tragic
23.1%
Sub-Saharan Africans
0.1
/100
|
#271
Tragic
23.2%
Immigrants | Senegal
0.1
/100
|
#272
Tragic
23.2%
Alaska Natives
0.1
/100
|
#273
Tragic
23.3%
Marshallese
0.1
/100
|
#274
Tragic
23.3%
Mexican American Indians
0.1
/100
|
#275
Tragic
23.4%
Immigrants | Azores
0.0
/100
|
#276
Tragic
23.5%
Pennsylvania Germans
0.0
/100
|
#277
Tragic
23.6%
Immigrants | Nonimmigrants
0.0
/100
|
#278
Tragic
23.6%

Demographics Similar to Immigrants from Venezuela by Single Female Poverty

In terms of single female poverty, the demographic groups most similar to Immigrants from Venezuela are Immigrants from Iraq (20.2%, a difference of 0.050%), Immigrants from Canada (20.2%, a difference of 0.060%), Immigrants from England (20.2%, a difference of 0.090%), Pakistani (20.2%, a difference of 0.12%), and Uruguayan (20.2%, a difference of 0.12%).
DemographicsRating | RankSingle Female Poverty
Mongolians
93.2
/100
|
#127
Exceptional
20.2%
Immigrants | Spain
92.7
/100
|
#128
Exceptional
20.2%
Immigrants | Morocco
92.4
/100
|
#129
Exceptional
20.2%
Immigrants | Hungary
92.3
/100
|
#130
Exceptional
20.2%
Pakistanis
92.1
/100
|
#131
Exceptional
20.2%
Uruguayans
92.1
/100
|
#132
Exceptional
20.2%
Immigrants | England
91.9
/100
|
#133
Exceptional
20.2%
Immigrants | Venezuela
91.5
/100
|
#134
Exceptional
20.2%
Immigrants | Iraq
91.2
/100
|
#135
Exceptional
20.2%
Immigrants | Canada
91.2
/100
|
#136
Exceptional
20.2%
Immigrants | Nepal
90.6
/100
|
#137
Exceptional
20.3%
Slovenes
90.5
/100
|
#138
Exceptional
20.3%
Immigrants | Kuwait
90.4
/100
|
#139
Exceptional
20.3%
Syrians
90.4
/100
|
#140
Exceptional
20.3%
Immigrants | North America
89.5
/100
|
#141
Excellent
20.3%