Subsaharan African vs Black/African American Seniors Poverty Over the Age of 75
COMPARE
Subsaharan African
Black/African American
Seniors Poverty Over the Age of 75
Seniors Poverty Over the Age of 75 Comparison
Sub-Saharan Africans
Blacks/African Americans
13.2%
SENIORS POVERTY OVER THE AGE OF 75
1.5/ 100
METRIC RATING
231st/ 347
METRIC RANK
14.6%
SENIORS POVERTY OVER THE AGE OF 75
0.0/ 100
METRIC RATING
279th/ 347
METRIC RANK
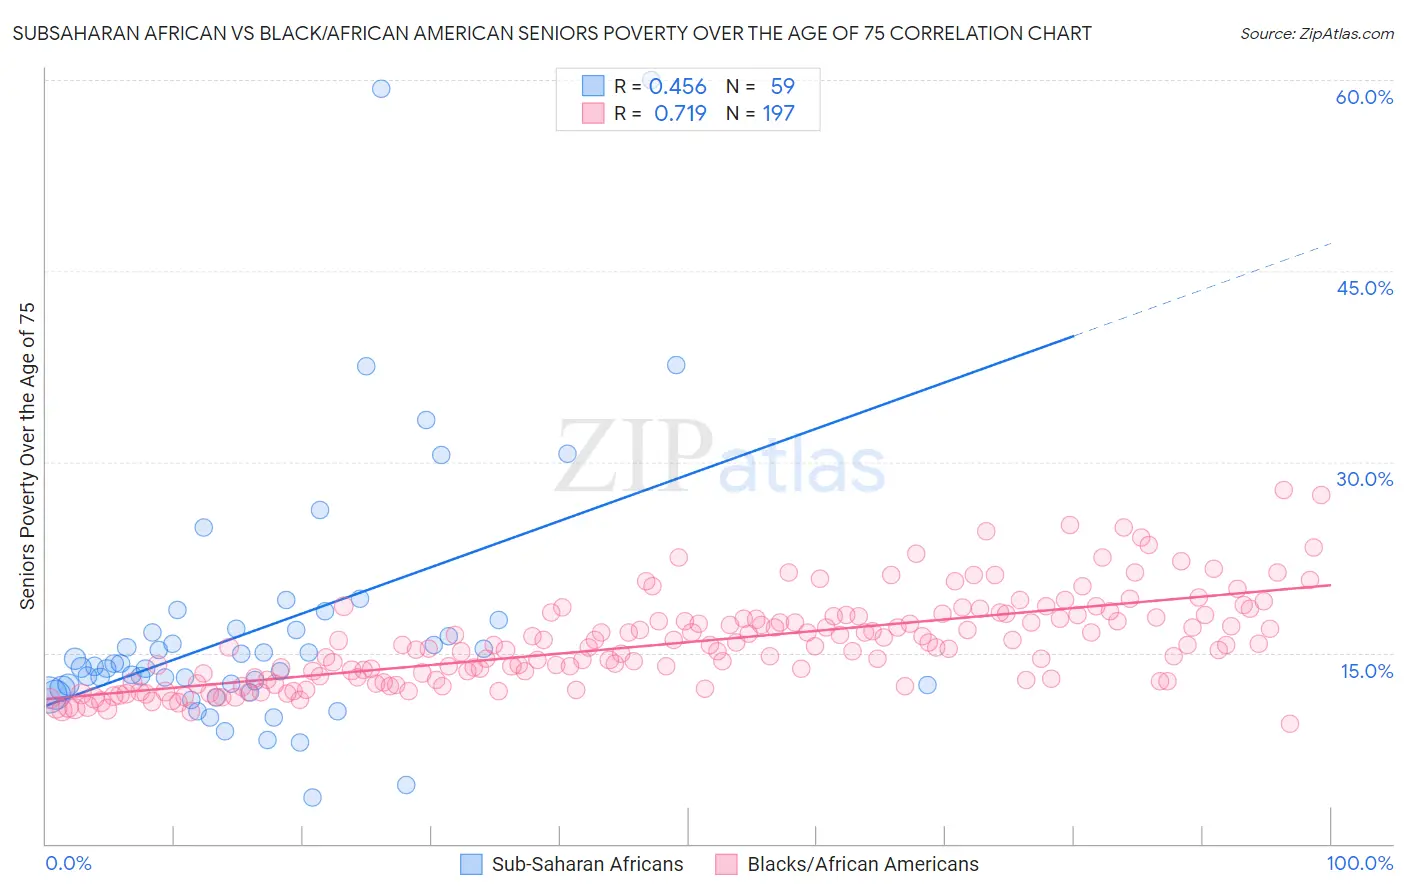
Subsaharan African vs Black/African American Seniors Poverty Over the Age of 75 Correlation Chart
The statistical analysis conducted on geographies consisting of 499,481,078 people shows a moderate positive correlation between the proportion of Sub-Saharan Africans and poverty level among seniors over the age of 75 in the United States with a correlation coefficient (R) of 0.456 and weighted average of 13.2%. Similarly, the statistical analysis conducted on geographies consisting of 551,157,628 people shows a strong positive correlation between the proportion of Blacks/African Americans and poverty level among seniors over the age of 75 in the United States with a correlation coefficient (R) of 0.719 and weighted average of 14.6%, a difference of 10.7%.
Seniors Poverty Over the Age of 75 Correlation Summary
| Measurement | Subsaharan African | Black/African American |
| Minimum | 3.6% | 9.4% |
| Maximum | 60.0% | 27.7% |
| Range | 56.4% | 18.3% |
| Mean | 17.1% | 15.8% |
| Median | 13.9% | 15.4% |
| Interquartile 25% (IQ1) | 12.2% | 12.9% |
| Interquartile 75% (IQ3) | 16.9% | 17.8% |
| Interquartile Range (IQR) | 4.7% | 4.9% |
| Standard Deviation (Sample) | 10.6% | 3.5% |
| Standard Deviation (Population) | 10.5% | 3.5% |
Similar Demographics by Seniors Poverty Over the Age of 75
Demographics Similar to Sub-Saharan Africans by Seniors Poverty Over the Age of 75
In terms of seniors poverty over the age of 75, the demographic groups most similar to Sub-Saharan Africans are Immigrants from China (13.2%, a difference of 0.010%), Somali (13.2%, a difference of 0.090%), Immigrants from Chile (13.3%, a difference of 0.20%), Immigrants from Costa Rica (13.3%, a difference of 0.23%), and Israeli (13.2%, a difference of 0.53%).
| Demographics | Rating | Rank | Seniors Poverty Over the Age of 75 |
| Chippewa | 2.9 /100 | #224 | Tragic 13.1% |
| Immigrants | Morocco | 2.8 /100 | #225 | Tragic 13.1% |
| Shoshone | 2.6 /100 | #226 | Tragic 13.1% |
| Cree | 2.3 /100 | #227 | Tragic 13.1% |
| Israelis | 2.0 /100 | #228 | Tragic 13.2% |
| Somalis | 1.6 /100 | #229 | Tragic 13.2% |
| Immigrants | China | 1.5 /100 | #230 | Tragic 13.2% |
| Sub-Saharan Africans | 1.5 /100 | #231 | Tragic 13.2% |
| Immigrants | Chile | 1.3 /100 | #232 | Tragic 13.3% |
| Immigrants | Costa Rica | 1.3 /100 | #233 | Tragic 13.3% |
| Immigrants | Israel | 1.1 /100 | #234 | Tragic 13.3% |
| Japanese | 0.9 /100 | #235 | Tragic 13.3% |
| Moroccans | 0.9 /100 | #236 | Tragic 13.3% |
| Alaskan Athabascans | 0.8 /100 | #237 | Tragic 13.4% |
| Peruvians | 0.8 /100 | #238 | Tragic 13.4% |
Demographics Similar to Blacks/African Americans by Seniors Poverty Over the Age of 75
In terms of seniors poverty over the age of 75, the demographic groups most similar to Blacks/African Americans are Immigrants from Colombia (14.6%, a difference of 0.21%), Central American (14.7%, a difference of 0.64%), Belizean (14.8%, a difference of 0.76%), Immigrants from Senegal (14.8%, a difference of 0.93%), and Senegalese (14.5%, a difference of 0.99%).
| Demographics | Rating | Rank | Seniors Poverty Over the Age of 75 |
| Mexicans | 0.0 /100 | #272 | Tragic 14.4% |
| Immigrants | South America | 0.0 /100 | #273 | Tragic 14.4% |
| Immigrants | Bahamas | 0.0 /100 | #274 | Tragic 14.4% |
| Immigrants | El Salvador | 0.0 /100 | #275 | Tragic 14.5% |
| Soviet Union | 0.0 /100 | #276 | Tragic 14.5% |
| Senegalese | 0.0 /100 | #277 | Tragic 14.5% |
| Immigrants | Colombia | 0.0 /100 | #278 | Tragic 14.6% |
| Blacks/African Americans | 0.0 /100 | #279 | Tragic 14.6% |
| Central Americans | 0.0 /100 | #280 | Tragic 14.7% |
| Belizeans | 0.0 /100 | #281 | Tragic 14.8% |
| Immigrants | Senegal | 0.0 /100 | #282 | Tragic 14.8% |
| Guatemalans | 0.0 /100 | #283 | Tragic 14.8% |
| Cheyenne | 0.0 /100 | #284 | Tragic 14.9% |
| Immigrants | Mexico | 0.0 /100 | #285 | Tragic 14.9% |
| Immigrants | Central America | 0.0 /100 | #286 | Tragic 15.0% |