Subsaharan African vs Black/African American In Labor Force | Age 25-29
COMPARE
Subsaharan African
Black/African American
In Labor Force | Age 25-29
In Labor Force | Age 25-29 Comparison
Sub-Saharan Africans
Blacks/African Americans
84.3%
IN LABOR FORCE | AGE 25-29
11.7/ 100
METRIC RATING
212th/ 347
METRIC RANK
82.6%
IN LABOR FORCE | AGE 25-29
0.0/ 100
METRIC RATING
305th/ 347
METRIC RANK
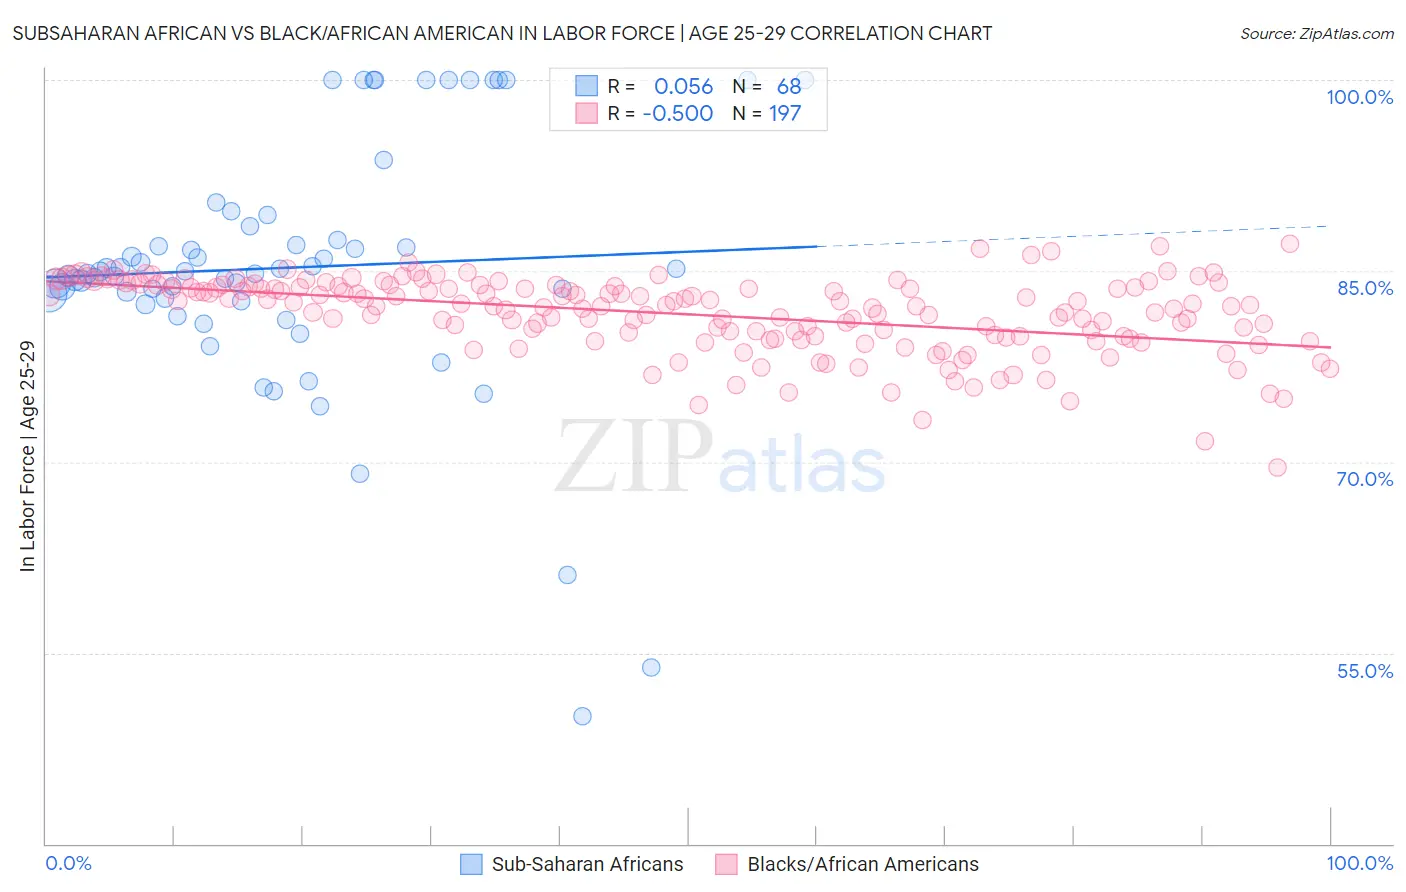
Subsaharan African vs Black/African American In Labor Force | Age 25-29 Correlation Chart
The statistical analysis conducted on geographies consisting of 507,839,893 people shows a slight positive correlation between the proportion of Sub-Saharan Africans and labor force participation rate among population between the ages 25 and 29 in the United States with a correlation coefficient (R) of 0.056 and weighted average of 84.3%. Similarly, the statistical analysis conducted on geographies consisting of 565,000,978 people shows a moderate negative correlation between the proportion of Blacks/African Americans and labor force participation rate among population between the ages 25 and 29 in the United States with a correlation coefficient (R) of -0.500 and weighted average of 82.6%, a difference of 2.1%.
In Labor Force | Age 25-29 Correlation Summary
| Measurement | Subsaharan African | Black/African American |
| Minimum | 50.0% | 69.5% |
| Maximum | 100.0% | 87.2% |
| Range | 50.0% | 17.6% |
| Mean | 85.3% | 81.6% |
| Median | 84.9% | 82.3% |
| Interquartile 25% (IQ1) | 82.7% | 79.8% |
| Interquartile 75% (IQ3) | 88.0% | 83.9% |
| Interquartile Range (IQR) | 5.2% | 4.0% |
| Standard Deviation (Sample) | 9.9% | 3.0% |
| Standard Deviation (Population) | 9.8% | 3.0% |
Similar Demographics by In Labor Force | Age 25-29
Demographics Similar to Sub-Saharan Africans by In Labor Force | Age 25-29
In terms of in labor force | age 25-29, the demographic groups most similar to Sub-Saharan Africans are Japanese (84.3%, a difference of 0.0%), Lebanese (84.3%, a difference of 0.010%), Immigrants from Jordan (84.4%, a difference of 0.020%), Chinese (84.3%, a difference of 0.020%), and Immigrants from Venezuela (84.3%, a difference of 0.020%).
| Demographics | Rating | Rank | In Labor Force | Age 25-29 |
| Ecuadorians | 14.8 /100 | #205 | Poor 84.4% |
| Immigrants | Cambodia | 14.3 /100 | #206 | Poor 84.4% |
| Immigrants | Armenia | 13.3 /100 | #207 | Poor 84.4% |
| Immigrants | Indonesia | 13.2 /100 | #208 | Poor 84.4% |
| Immigrants | Jordan | 12.8 /100 | #209 | Poor 84.4% |
| Chinese | 12.7 /100 | #210 | Poor 84.3% |
| Immigrants | Venezuela | 12.6 /100 | #211 | Poor 84.3% |
| Sub-Saharan Africans | 11.7 /100 | #212 | Poor 84.3% |
| Japanese | 11.4 /100 | #213 | Poor 84.3% |
| Lebanese | 11.1 /100 | #214 | Poor 84.3% |
| Immigrants | Syria | 10.7 /100 | #215 | Poor 84.3% |
| Israelis | 9.3 /100 | #216 | Tragic 84.3% |
| Immigrants | Ecuador | 9.3 /100 | #217 | Tragic 84.3% |
| Immigrants | Nigeria | 9.0 /100 | #218 | Tragic 84.3% |
| Immigrants | Saudi Arabia | 8.8 /100 | #219 | Tragic 84.3% |
Demographics Similar to Blacks/African Americans by In Labor Force | Age 25-29
In terms of in labor force | age 25-29, the demographic groups most similar to Blacks/African Americans are Blackfeet (82.6%, a difference of 0.010%), Cajun (82.5%, a difference of 0.060%), Immigrants from St. Vincent and the Grenadines (82.7%, a difference of 0.12%), Central American Indian (82.4%, a difference of 0.21%), and Immigrants from Central America (82.4%, a difference of 0.22%).
| Demographics | Rating | Rank | In Labor Force | Age 25-29 |
| Native Hawaiians | 0.0 /100 | #298 | Tragic 82.9% |
| Fijians | 0.0 /100 | #299 | Tragic 82.9% |
| Spanish American Indians | 0.0 /100 | #300 | Tragic 82.9% |
| Vietnamese | 0.0 /100 | #301 | Tragic 82.8% |
| Immigrants | Belize | 0.0 /100 | #302 | Tragic 82.8% |
| Immigrants | Grenada | 0.0 /100 | #303 | Tragic 82.8% |
| Immigrants | St. Vincent and the Grenadines | 0.0 /100 | #304 | Tragic 82.7% |
| Blacks/African Americans | 0.0 /100 | #305 | Tragic 82.6% |
| Blackfeet | 0.0 /100 | #306 | Tragic 82.6% |
| Cajuns | 0.0 /100 | #307 | Tragic 82.5% |
| Central American Indians | 0.0 /100 | #308 | Tragic 82.4% |
| Immigrants | Central America | 0.0 /100 | #309 | Tragic 82.4% |
| Osage | 0.0 /100 | #310 | Tragic 82.3% |
| Alaskan Athabascans | 0.0 /100 | #311 | Tragic 82.3% |
| Hispanics or Latinos | 0.0 /100 | #312 | Tragic 82.2% |