Subsaharan African vs Immigrants from Caribbean Single Female Poverty
COMPARE
Subsaharan African
Immigrants from Caribbean
Single Female Poverty
Single Female Poverty Comparison
Sub-Saharan Africans
Immigrants from Caribbean
23.2%
SINGLE FEMALE POVERTY
0.1/ 100
METRIC RATING
271st/ 347
METRIC RANK
22.4%
SINGLE FEMALE POVERTY
1.3/ 100
METRIC RATING
249th/ 347
METRIC RANK
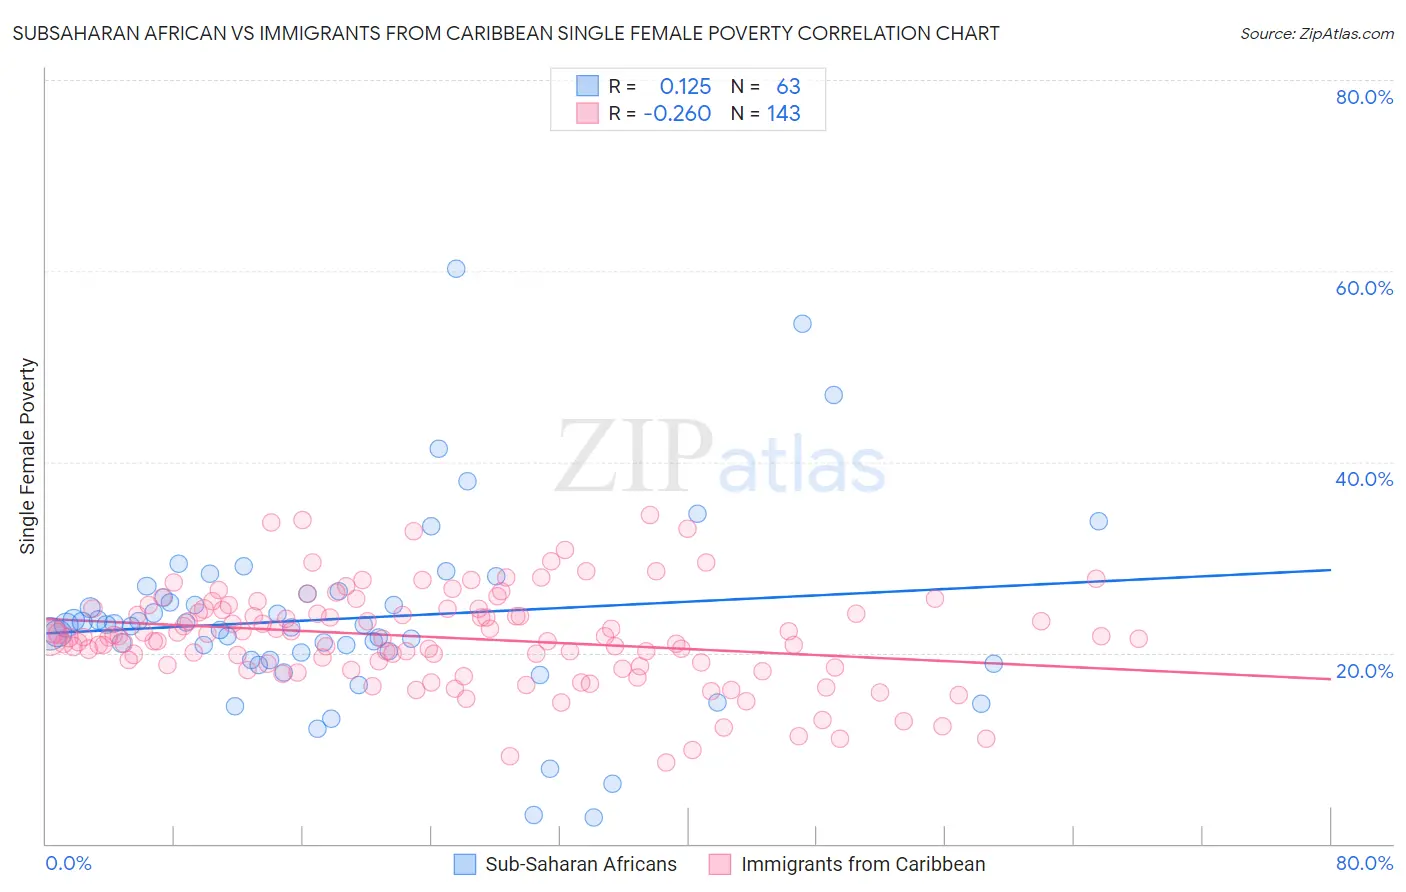
Subsaharan African vs Immigrants from Caribbean Single Female Poverty Correlation Chart
The statistical analysis conducted on geographies consisting of 498,393,739 people shows a poor positive correlation between the proportion of Sub-Saharan Africans and poverty level among single females in the United States with a correlation coefficient (R) of 0.125 and weighted average of 23.2%. Similarly, the statistical analysis conducted on geographies consisting of 441,756,238 people shows a weak negative correlation between the proportion of Immigrants from Caribbean and poverty level among single females in the United States with a correlation coefficient (R) of -0.260 and weighted average of 22.4%, a difference of 3.4%.
Single Female Poverty Correlation Summary
| Measurement | Subsaharan African | Immigrants from Caribbean |
| Minimum | 2.8% | 8.5% |
| Maximum | 60.3% | 34.5% |
| Range | 57.5% | 25.9% |
| Mean | 23.6% | 21.6% |
| Median | 22.9% | 21.7% |
| Interquartile 25% (IQ1) | 19.3% | 18.7% |
| Interquartile 75% (IQ3) | 26.2% | 24.6% |
| Interquartile Range (IQR) | 6.9% | 5.9% |
| Standard Deviation (Sample) | 9.9% | 5.0% |
| Standard Deviation (Population) | 9.8% | 5.0% |
Similar Demographics by Single Female Poverty
Demographics Similar to Sub-Saharan Africans by Single Female Poverty
In terms of single female poverty, the demographic groups most similar to Sub-Saharan Africans are Immigrants from Senegal (23.2%, a difference of 0.19%), Inupiat (23.1%, a difference of 0.25%), Alaska Native (23.3%, a difference of 0.44%), Marshallese (23.3%, a difference of 0.45%), and Hmong (23.1%, a difference of 0.50%).
| Demographics | Rating | Rank | Single Female Poverty |
| Immigrants | Laos | 0.3 /100 | #264 | Tragic 22.9% |
| Central Americans | 0.2 /100 | #265 | Tragic 23.0% |
| Immigrants | Micronesia | 0.2 /100 | #266 | Tragic 23.0% |
| Senegalese | 0.2 /100 | #267 | Tragic 23.0% |
| Fijians | 0.2 /100 | #268 | Tragic 23.1% |
| Hmong | 0.2 /100 | #269 | Tragic 23.1% |
| Inupiat | 0.2 /100 | #270 | Tragic 23.1% |
| Sub-Saharan Africans | 0.1 /100 | #271 | Tragic 23.2% |
| Immigrants | Senegal | 0.1 /100 | #272 | Tragic 23.2% |
| Alaska Natives | 0.1 /100 | #273 | Tragic 23.3% |
| Marshallese | 0.1 /100 | #274 | Tragic 23.3% |
| Mexican American Indians | 0.1 /100 | #275 | Tragic 23.4% |
| Immigrants | Azores | 0.0 /100 | #276 | Tragic 23.5% |
| Pennsylvania Germans | 0.0 /100 | #277 | Tragic 23.6% |
| Immigrants | Nonimmigrants | 0.0 /100 | #278 | Tragic 23.6% |
Demographics Similar to Immigrants from Caribbean by Single Female Poverty
In terms of single female poverty, the demographic groups most similar to Immigrants from Caribbean are Belizean (22.4%, a difference of 0.10%), Immigrants from El Salvador (22.4%, a difference of 0.11%), Immigrants from Bahamas (22.5%, a difference of 0.15%), Liberian (22.4%, a difference of 0.17%), and Immigrants from West Indies (22.5%, a difference of 0.29%).
| Demographics | Rating | Rank | Single Female Poverty |
| Bermudans | 2.0 /100 | #242 | Tragic 22.3% |
| West Indians | 1.9 /100 | #243 | Tragic 22.3% |
| Immigrants | Middle Africa | 1.9 /100 | #244 | Tragic 22.3% |
| Immigrants | Bangladesh | 1.8 /100 | #245 | Tragic 22.3% |
| Liberians | 1.4 /100 | #246 | Tragic 22.4% |
| Immigrants | El Salvador | 1.4 /100 | #247 | Tragic 22.4% |
| Belizeans | 1.4 /100 | #248 | Tragic 22.4% |
| Immigrants | Caribbean | 1.3 /100 | #249 | Tragic 22.4% |
| Immigrants | Bahamas | 1.2 /100 | #250 | Tragic 22.5% |
| Immigrants | West Indies | 1.0 /100 | #251 | Tragic 22.5% |
| Delaware | 1.0 /100 | #252 | Tragic 22.5% |
| Immigrants | Liberia | 0.9 /100 | #253 | Tragic 22.5% |
| Immigrants | Burma/Myanmar | 0.8 /100 | #254 | Tragic 22.6% |
| Immigrants | Sudan | 0.8 /100 | #255 | Tragic 22.6% |
| Immigrants | Belize | 0.8 /100 | #256 | Tragic 22.6% |