Subsaharan African vs Black/African American Unemployment Among Ages 60 to 64 years
COMPARE
Subsaharan African
Black/African American
Unemployment Among Ages 60 to 64 years
Unemployment Among Ages 60 to 64 years Comparison
Sub-Saharan Africans
Blacks/African Americans
4.9%
UNEMPLOYMENT AMONG AGES 60 TO 64 YEARS
38.9/ 100
METRIC RATING
183rd/ 347
METRIC RANK
5.3%
UNEMPLOYMENT AMONG AGES 60 TO 64 YEARS
0.0/ 100
METRIC RATING
294th/ 347
METRIC RANK
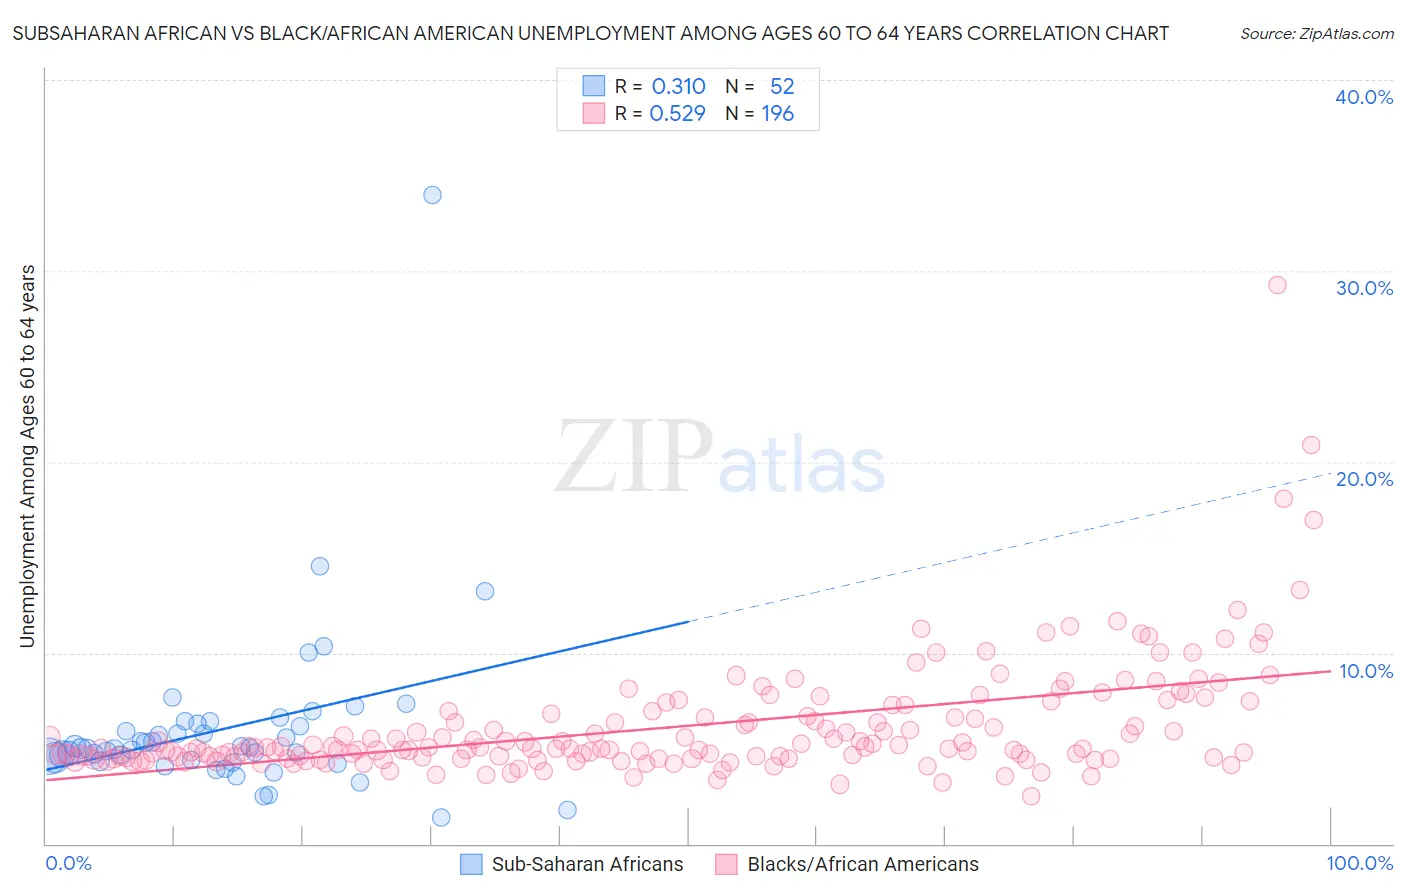
Subsaharan African vs Black/African American Unemployment Among Ages 60 to 64 years Correlation Chart
The statistical analysis conducted on geographies consisting of 438,711,517 people shows a mild positive correlation between the proportion of Sub-Saharan Africans and unemployment rate among population between the ages 60 and 64 in the United States with a correlation coefficient (R) of 0.310 and weighted average of 4.9%. Similarly, the statistical analysis conducted on geographies consisting of 465,577,423 people shows a substantial positive correlation between the proportion of Blacks/African Americans and unemployment rate among population between the ages 60 and 64 in the United States with a correlation coefficient (R) of 0.529 and weighted average of 5.3%, a difference of 9.0%.
Unemployment Among Ages 60 to 64 years Correlation Summary
| Measurement | Subsaharan African | Black/African American |
| Minimum | 1.4% | 2.5% |
| Maximum | 34.0% | 29.2% |
| Range | 32.6% | 26.7% |
| Mean | 6.0% | 6.1% |
| Median | 5.0% | 5.0% |
| Interquartile 25% (IQ1) | 4.4% | 4.5% |
| Interquartile 75% (IQ3) | 6.2% | 6.7% |
| Interquartile Range (IQR) | 1.8% | 2.2% |
| Standard Deviation (Sample) | 4.6% | 3.1% |
| Standard Deviation (Population) | 4.6% | 3.1% |
Similar Demographics by Unemployment Among Ages 60 to 64 years
Demographics Similar to Sub-Saharan Africans by Unemployment Among Ages 60 to 64 years
In terms of unemployment among ages 60 to 64 years, the demographic groups most similar to Sub-Saharan Africans are Sri Lankan (4.9%, a difference of 0.030%), Immigrants from Ukraine (4.9%, a difference of 0.050%), Ute (4.9%, a difference of 0.050%), Asian (4.9%, a difference of 0.070%), and Hungarian (4.9%, a difference of 0.070%).
| Demographics | Rating | Rank | Unemployment Among Ages 60 to 64 years |
| Bermudans | 46.5 /100 | #176 | Average 4.9% |
| Immigrants | Malaysia | 44.7 /100 | #177 | Average 4.9% |
| Immigrants | Nonimmigrants | 44.5 /100 | #178 | Average 4.9% |
| Immigrants | Sweden | 44.3 /100 | #179 | Average 4.9% |
| Asians | 40.8 /100 | #180 | Average 4.9% |
| Hungarians | 40.6 /100 | #181 | Average 4.9% |
| Sri Lankans | 39.8 /100 | #182 | Fair 4.9% |
| Sub-Saharan Africans | 38.9 /100 | #183 | Fair 4.9% |
| Immigrants | Ukraine | 37.6 /100 | #184 | Fair 4.9% |
| Ute | 37.4 /100 | #185 | Fair 4.9% |
| Spaniards | 35.8 /100 | #186 | Fair 4.9% |
| South American Indians | 31.2 /100 | #187 | Fair 4.9% |
| Nicaraguans | 30.4 /100 | #188 | Fair 4.9% |
| Immigrants | Nicaragua | 29.8 /100 | #189 | Fair 4.9% |
| Immigrants | Europe | 29.8 /100 | #190 | Fair 4.9% |
Demographics Similar to Blacks/African Americans by Unemployment Among Ages 60 to 64 years
In terms of unemployment among ages 60 to 64 years, the demographic groups most similar to Blacks/African Americans are Armenian (5.3%, a difference of 0.030%), Immigrants from Israel (5.3%, a difference of 0.11%), Immigrants from Latin America (5.3%, a difference of 0.13%), Hispanic or Latino (5.3%, a difference of 0.15%), and Jamaican (5.3%, a difference of 0.15%).
| Demographics | Rating | Rank | Unemployment Among Ages 60 to 64 years |
| Salvadorans | 0.0 /100 | #287 | Tragic 5.3% |
| Trinidadians and Tobagonians | 0.0 /100 | #288 | Tragic 5.3% |
| Spanish Americans | 0.0 /100 | #289 | Tragic 5.3% |
| Immigrants | Trinidad and Tobago | 0.0 /100 | #290 | Tragic 5.3% |
| Hispanics or Latinos | 0.0 /100 | #291 | Tragic 5.3% |
| Immigrants | Latin America | 0.0 /100 | #292 | Tragic 5.3% |
| Immigrants | Israel | 0.0 /100 | #293 | Tragic 5.3% |
| Blacks/African Americans | 0.0 /100 | #294 | Tragic 5.3% |
| Armenians | 0.0 /100 | #295 | Tragic 5.3% |
| Jamaicans | 0.0 /100 | #296 | Tragic 5.3% |
| Osage | 0.0 /100 | #297 | Tragic 5.4% |
| Immigrants | Central America | 0.0 /100 | #298 | Tragic 5.4% |
| Immigrants | El Salvador | 0.0 /100 | #299 | Tragic 5.4% |
| Immigrants | Barbados | 0.0 /100 | #300 | Tragic 5.4% |
| Immigrants | Jamaica | 0.0 /100 | #301 | Tragic 5.4% |