Subsaharan African vs Romanian Single Female Poverty
COMPARE
Subsaharan African
Romanian
Single Female Poverty
Single Female Poverty Comparison
Sub-Saharan Africans
Romanians
23.2%
SINGLE FEMALE POVERTY
0.1/ 100
METRIC RATING
271st/ 347
METRIC RANK
19.6%
SINGLE FEMALE POVERTY
98.6/ 100
METRIC RATING
94th/ 347
METRIC RANK
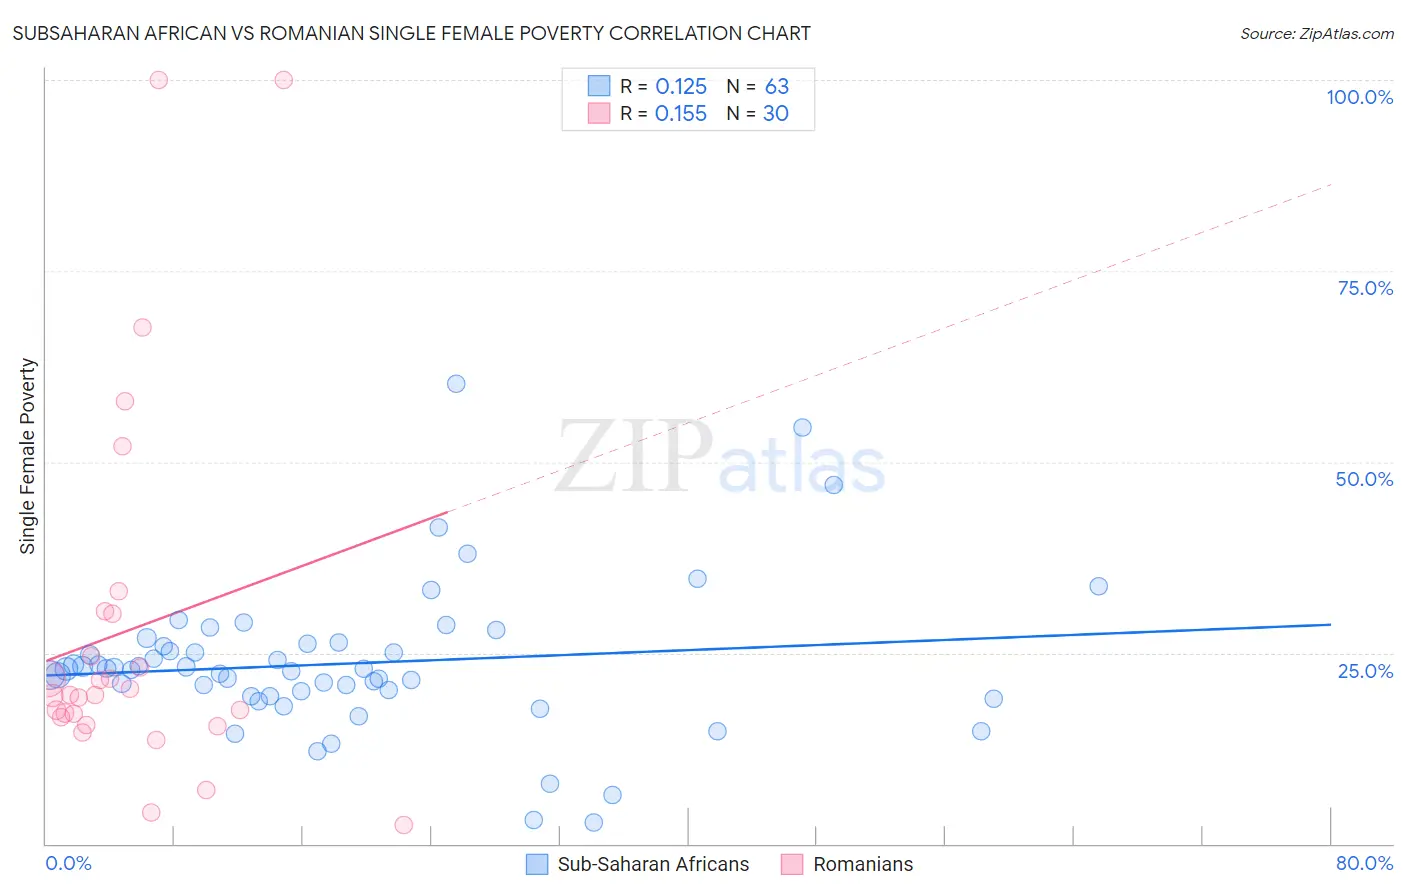
Subsaharan African vs Romanian Single Female Poverty Correlation Chart
The statistical analysis conducted on geographies consisting of 498,393,739 people shows a poor positive correlation between the proportion of Sub-Saharan Africans and poverty level among single females in the United States with a correlation coefficient (R) of 0.125 and weighted average of 23.2%. Similarly, the statistical analysis conducted on geographies consisting of 371,309,640 people shows a poor positive correlation between the proportion of Romanians and poverty level among single females in the United States with a correlation coefficient (R) of 0.155 and weighted average of 19.6%, a difference of 18.2%.
Single Female Poverty Correlation Summary
| Measurement | Subsaharan African | Romanian |
| Minimum | 2.8% | 2.5% |
| Maximum | 60.3% | 100.0% |
| Range | 57.5% | 97.5% |
| Mean | 23.6% | 28.0% |
| Median | 22.9% | 19.5% |
| Interquartile 25% (IQ1) | 19.3% | 16.6% |
| Interquartile 75% (IQ3) | 26.2% | 30.1% |
| Interquartile Range (IQR) | 6.9% | 13.5% |
| Standard Deviation (Sample) | 9.9% | 24.2% |
| Standard Deviation (Population) | 9.8% | 23.7% |
Similar Demographics by Single Female Poverty
Demographics Similar to Sub-Saharan Africans by Single Female Poverty
In terms of single female poverty, the demographic groups most similar to Sub-Saharan Africans are Immigrants from Senegal (23.2%, a difference of 0.19%), Inupiat (23.1%, a difference of 0.25%), Alaska Native (23.3%, a difference of 0.44%), Marshallese (23.3%, a difference of 0.45%), and Hmong (23.1%, a difference of 0.50%).
| Demographics | Rating | Rank | Single Female Poverty |
| Immigrants | Laos | 0.3 /100 | #264 | Tragic 22.9% |
| Central Americans | 0.2 /100 | #265 | Tragic 23.0% |
| Immigrants | Micronesia | 0.2 /100 | #266 | Tragic 23.0% |
| Senegalese | 0.2 /100 | #267 | Tragic 23.0% |
| Fijians | 0.2 /100 | #268 | Tragic 23.1% |
| Hmong | 0.2 /100 | #269 | Tragic 23.1% |
| Inupiat | 0.2 /100 | #270 | Tragic 23.1% |
| Sub-Saharan Africans | 0.1 /100 | #271 | Tragic 23.2% |
| Immigrants | Senegal | 0.1 /100 | #272 | Tragic 23.2% |
| Alaska Natives | 0.1 /100 | #273 | Tragic 23.3% |
| Marshallese | 0.1 /100 | #274 | Tragic 23.3% |
| Mexican American Indians | 0.1 /100 | #275 | Tragic 23.4% |
| Immigrants | Azores | 0.0 /100 | #276 | Tragic 23.5% |
| Pennsylvania Germans | 0.0 /100 | #277 | Tragic 23.6% |
| Immigrants | Nonimmigrants | 0.0 /100 | #278 | Tragic 23.6% |
Demographics Similar to Romanians by Single Female Poverty
In terms of single female poverty, the demographic groups most similar to Romanians are Immigrants from Austria (19.6%, a difference of 0.22%), Italian (19.6%, a difference of 0.23%), Soviet Union (19.6%, a difference of 0.28%), Immigrants from Lebanon (19.6%, a difference of 0.34%), and Estonian (19.7%, a difference of 0.38%).
| Demographics | Rating | Rank | Single Female Poverty |
| Zimbabweans | 99.0 /100 | #87 | Exceptional 19.5% |
| Afghans | 99.0 /100 | #88 | Exceptional 19.5% |
| Immigrants | Ukraine | 99.0 /100 | #89 | Exceptional 19.5% |
| Immigrants | Lebanon | 98.8 /100 | #90 | Exceptional 19.6% |
| Soviet Union | 98.8 /100 | #91 | Exceptional 19.6% |
| Italians | 98.8 /100 | #92 | Exceptional 19.6% |
| Immigrants | Austria | 98.8 /100 | #93 | Exceptional 19.6% |
| Romanians | 98.6 /100 | #94 | Exceptional 19.6% |
| Estonians | 98.2 /100 | #95 | Exceptional 19.7% |
| Immigrants | Brazil | 98.2 /100 | #96 | Exceptional 19.7% |
| Croatians | 98.1 /100 | #97 | Exceptional 19.7% |
| Immigrants | France | 97.9 /100 | #98 | Exceptional 19.7% |
| Sierra Leoneans | 97.9 /100 | #99 | Exceptional 19.7% |
| Ukrainians | 97.6 /100 | #100 | Exceptional 19.8% |
| Immigrants | Belgium | 97.3 /100 | #101 | Exceptional 19.8% |