Slovene vs Immigrants from Haiti High School Diploma
COMPARE
Slovene
Immigrants from Haiti
High School Diploma
High School Diploma Comparison
Slovenes
Immigrants from Haiti
92.0%
HIGH SCHOOL DIPLOMA
100.0/ 100
METRIC RATING
5th/ 347
METRIC RANK
85.4%
HIGH SCHOOL DIPLOMA
0.0/ 100
METRIC RATING
302nd/ 347
METRIC RANK
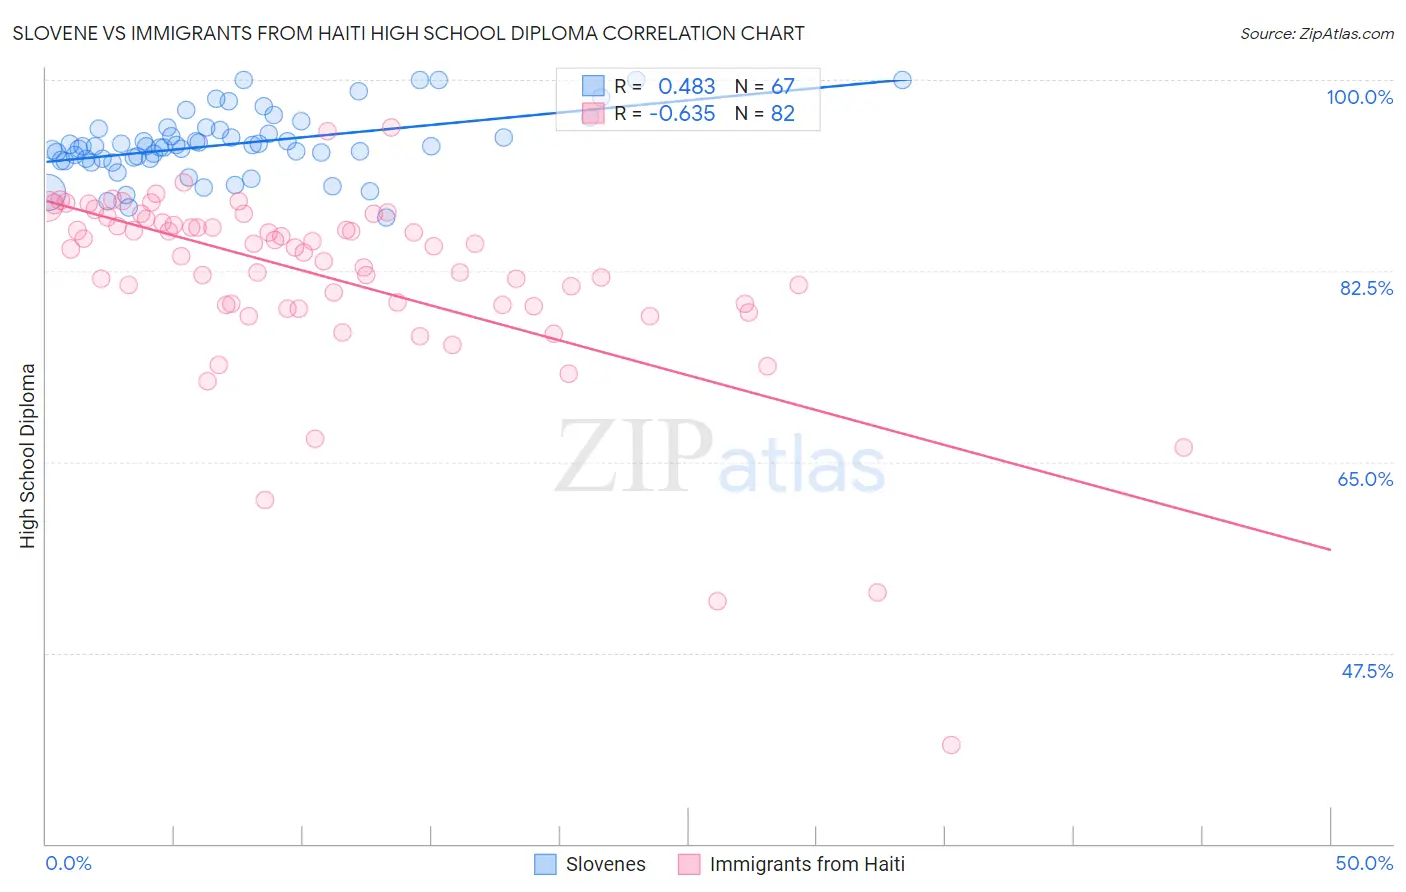
Slovene vs Immigrants from Haiti High School Diploma Correlation Chart
The statistical analysis conducted on geographies consisting of 261,353,550 people shows a moderate positive correlation between the proportion of Slovenes and percentage of population with at least high school diploma education in the United States with a correlation coefficient (R) of 0.483 and weighted average of 92.0%. Similarly, the statistical analysis conducted on geographies consisting of 225,286,636 people shows a significant negative correlation between the proportion of Immigrants from Haiti and percentage of population with at least high school diploma education in the United States with a correlation coefficient (R) of -0.635 and weighted average of 85.4%, a difference of 7.8%.
High School Diploma Correlation Summary
| Measurement | Slovene | Immigrants from Haiti |
| Minimum | 87.4% | 39.0% |
| Maximum | 100.0% | 95.6% |
| Range | 12.6% | 56.6% |
| Mean | 94.1% | 81.9% |
| Median | 93.9% | 84.6% |
| Interquartile 25% (IQ1) | 92.8% | 79.3% |
| Interquartile 75% (IQ3) | 95.6% | 86.9% |
| Interquartile Range (IQR) | 2.8% | 7.6% |
| Standard Deviation (Sample) | 2.9% | 8.9% |
| Standard Deviation (Population) | 2.9% | 8.9% |
Similar Demographics by High School Diploma
Demographics Similar to Slovenes by High School Diploma
In terms of high school diploma, the demographic groups most similar to Slovenes are Lithuanian (92.0%, a difference of 0.0%), Slovak (92.0%, a difference of 0.020%), Immigrants from India (92.0%, a difference of 0.020%), Chinese (92.0%, a difference of 0.040%), and Latvian (92.0%, a difference of 0.050%).
| Demographics | Rating | Rank | High School Diploma |
| Norwegians | 100.0 /100 | #1 | Exceptional 92.5% |
| Swedes | 100.0 /100 | #2 | Exceptional 92.2% |
| Carpatho Rusyns | 100.0 /100 | #3 | Exceptional 92.1% |
| Lithuanians | 100.0 /100 | #4 | Exceptional 92.0% |
| Slovenes | 100.0 /100 | #5 | Exceptional 92.0% |
| Slovaks | 100.0 /100 | #6 | Exceptional 92.0% |
| Immigrants | India | 100.0 /100 | #7 | Exceptional 92.0% |
| Chinese | 100.0 /100 | #8 | Exceptional 92.0% |
| Latvians | 100.0 /100 | #9 | Exceptional 92.0% |
| Croatians | 100.0 /100 | #10 | Exceptional 92.0% |
| Eastern Europeans | 100.0 /100 | #11 | Exceptional 91.9% |
| Poles | 100.0 /100 | #12 | Exceptional 91.9% |
| Danes | 100.0 /100 | #13 | Exceptional 91.8% |
| Bulgarians | 100.0 /100 | #14 | Exceptional 91.8% |
| Luxembourgers | 100.0 /100 | #15 | Exceptional 91.7% |
Demographics Similar to Immigrants from Haiti by High School Diploma
In terms of high school diploma, the demographic groups most similar to Immigrants from Haiti are Cuban (85.4%, a difference of 0.0%), Vietnamese (85.4%, a difference of 0.040%), Immigrants from Bangladesh (85.5%, a difference of 0.060%), Guyanese (85.5%, a difference of 0.080%), and Nepalese (85.3%, a difference of 0.11%).
| Demographics | Rating | Rank | High School Diploma |
| Immigrants | Immigrants | 0.0 /100 | #295 | Tragic 85.8% |
| Immigrants | Cambodia | 0.0 /100 | #296 | Tragic 85.6% |
| Immigrants | Grenada | 0.0 /100 | #297 | Tragic 85.6% |
| Natives/Alaskans | 0.0 /100 | #298 | Tragic 85.6% |
| Guyanese | 0.0 /100 | #299 | Tragic 85.5% |
| Immigrants | Bangladesh | 0.0 /100 | #300 | Tragic 85.5% |
| Vietnamese | 0.0 /100 | #301 | Tragic 85.4% |
| Immigrants | Haiti | 0.0 /100 | #302 | Tragic 85.4% |
| Cubans | 0.0 /100 | #303 | Tragic 85.4% |
| Nepalese | 0.0 /100 | #304 | Tragic 85.3% |
| Immigrants | Portugal | 0.0 /100 | #305 | Tragic 85.3% |
| Immigrants | Guyana | 0.0 /100 | #306 | Tragic 85.3% |
| Navajo | 0.0 /100 | #307 | Tragic 85.2% |
| Immigrants | Armenia | 0.0 /100 | #308 | Tragic 85.2% |
| Immigrants | Dominica | 0.0 /100 | #309 | Tragic 85.2% |