Slavic vs South African Single Female Poverty
COMPARE
Slavic
South African
Single Female Poverty
Single Female Poverty Comparison
Slavs
South Africans
21.1%
SINGLE FEMALE POVERTY
40.5/ 100
METRIC RATING
182nd/ 347
METRIC RANK
20.4%
SINGLE FEMALE POVERTY
85.3/ 100
METRIC RATING
147th/ 347
METRIC RANK
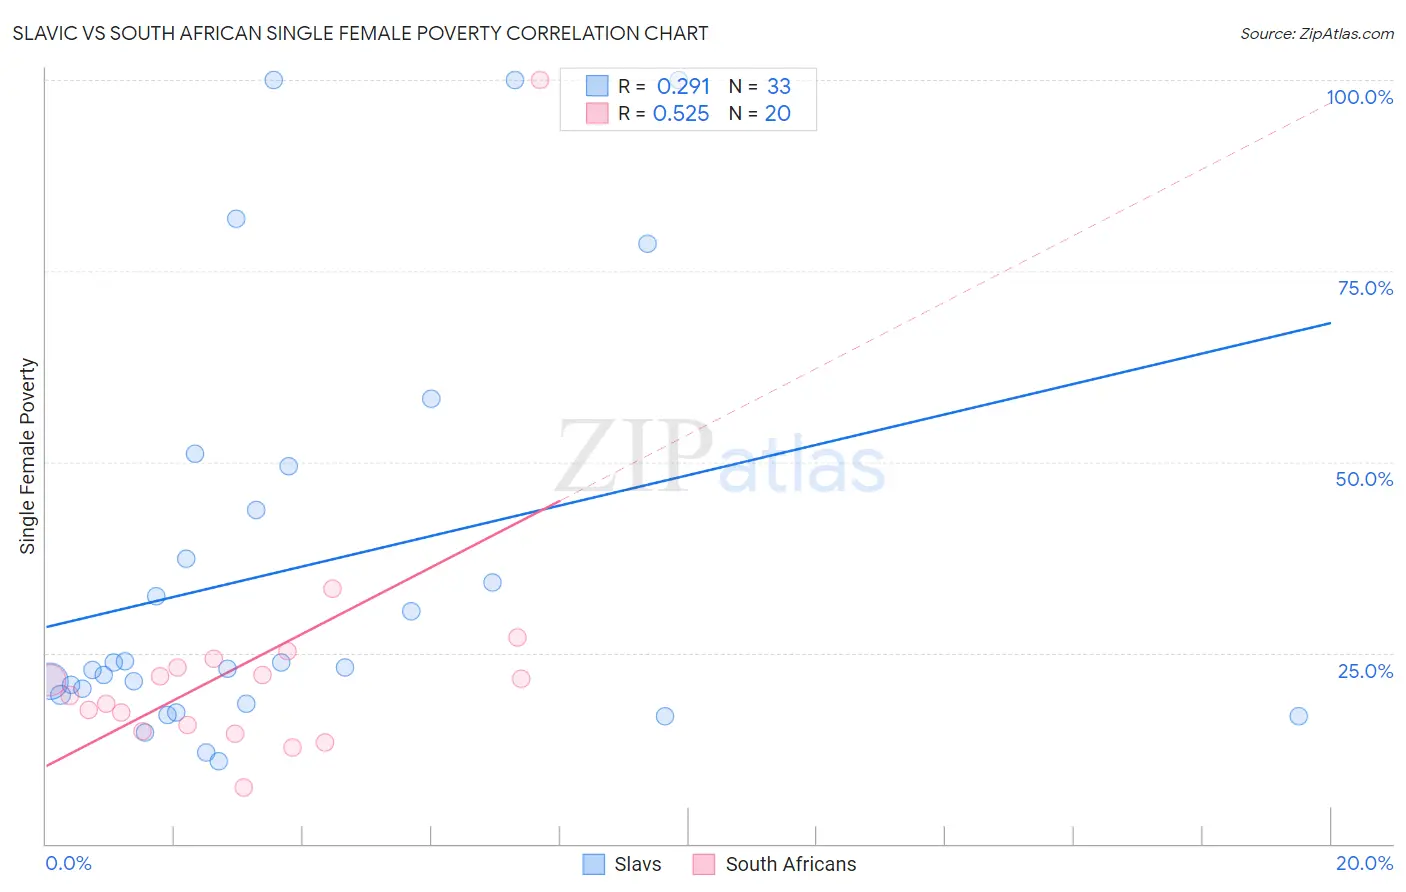
Slavic vs South African Single Female Poverty Correlation Chart
The statistical analysis conducted on geographies consisting of 267,477,501 people shows a weak positive correlation between the proportion of Slavs and poverty level among single females in the United States with a correlation coefficient (R) of 0.291 and weighted average of 21.1%. Similarly, the statistical analysis conducted on geographies consisting of 180,862,310 people shows a substantial positive correlation between the proportion of South Africans and poverty level among single females in the United States with a correlation coefficient (R) of 0.525 and weighted average of 20.4%, a difference of 3.4%.
Single Female Poverty Correlation Summary
| Measurement | Slavic | South African |
| Minimum | 10.9% | 7.4% |
| Maximum | 100.0% | 100.0% |
| Range | 89.1% | 92.6% |
| Mean | 35.9% | 23.5% |
| Median | 23.1% | 20.4% |
| Interquartile 25% (IQ1) | 18.9% | 15.2% |
| Interquartile 75% (IQ3) | 46.5% | 23.6% |
| Interquartile Range (IQR) | 27.7% | 8.4% |
| Standard Deviation (Sample) | 26.8% | 18.9% |
| Standard Deviation (Population) | 26.4% | 18.4% |
Similar Demographics by Single Female Poverty
Demographics Similar to Slavs by Single Female Poverty
In terms of single female poverty, the demographic groups most similar to Slavs are Slovak (21.1%, a difference of 0.050%), Hungarian (21.1%, a difference of 0.060%), Spanish American Indian (21.1%, a difference of 0.12%), European (21.1%, a difference of 0.12%), and British (21.1%, a difference of 0.15%).
| Demographics | Rating | Rank | Single Female Poverty |
| Czechs | 46.8 /100 | #175 | Average 21.0% |
| Canadians | 45.4 /100 | #176 | Average 21.1% |
| Scandinavians | 45.2 /100 | #177 | Average 21.1% |
| Immigrants | Bosnia and Herzegovina | 44.9 /100 | #178 | Average 21.1% |
| British | 42.9 /100 | #179 | Average 21.1% |
| Spanish American Indians | 42.5 /100 | #180 | Average 21.1% |
| Europeans | 42.3 /100 | #181 | Average 21.1% |
| Slavs | 40.5 /100 | #182 | Average 21.1% |
| Slovaks | 39.7 /100 | #183 | Fair 21.1% |
| Hungarians | 39.6 /100 | #184 | Fair 21.1% |
| Immigrants | Cambodia | 38.2 /100 | #185 | Fair 21.2% |
| Hawaiians | 37.7 /100 | #186 | Fair 21.2% |
| Immigrants | Nigeria | 36.8 /100 | #187 | Fair 21.2% |
| Yugoslavians | 35.4 /100 | #188 | Fair 21.2% |
| Immigrants | Cuba | 35.3 /100 | #189 | Fair 21.2% |
Demographics Similar to South Africans by Single Female Poverty
In terms of single female poverty, the demographic groups most similar to South Africans are Venezuelan (20.4%, a difference of 0.030%), Luxembourger (20.4%, a difference of 0.050%), Austrian (20.4%, a difference of 0.060%), Immigrants from Uzbekistan (20.3%, a difference of 0.42%), and Australian (20.3%, a difference of 0.43%).
| Demographics | Rating | Rank | Single Female Poverty |
| Syrians | 90.4 /100 | #140 | Exceptional 20.3% |
| Immigrants | North America | 89.5 /100 | #141 | Excellent 20.3% |
| Immigrants | Uganda | 89.1 /100 | #142 | Excellent 20.3% |
| Australians | 88.4 /100 | #143 | Excellent 20.3% |
| Immigrants | Uzbekistan | 88.3 /100 | #144 | Excellent 20.3% |
| Austrians | 85.8 /100 | #145 | Excellent 20.4% |
| Venezuelans | 85.5 /100 | #146 | Excellent 20.4% |
| South Africans | 85.3 /100 | #147 | Excellent 20.4% |
| Luxembourgers | 84.9 /100 | #148 | Excellent 20.4% |
| Portuguese | 81.5 /100 | #149 | Excellent 20.5% |
| Immigrants | Denmark | 80.5 /100 | #150 | Excellent 20.5% |
| Puget Sound Salish | 79.6 /100 | #151 | Good 20.6% |
| Immigrants | Uruguay | 77.7 /100 | #152 | Good 20.6% |
| Swedes | 77.1 /100 | #153 | Good 20.6% |
| Immigrants | Western Europe | 76.7 /100 | #154 | Good 20.6% |