Slavic vs Immigrants from England Single Female Poverty
COMPARE
Slavic
Immigrants from England
Single Female Poverty
Single Female Poverty Comparison
Slavs
Immigrants from England
21.1%
SINGLE FEMALE POVERTY
40.5/ 100
METRIC RATING
182nd/ 347
METRIC RANK
20.2%
SINGLE FEMALE POVERTY
91.9/ 100
METRIC RATING
133rd/ 347
METRIC RANK
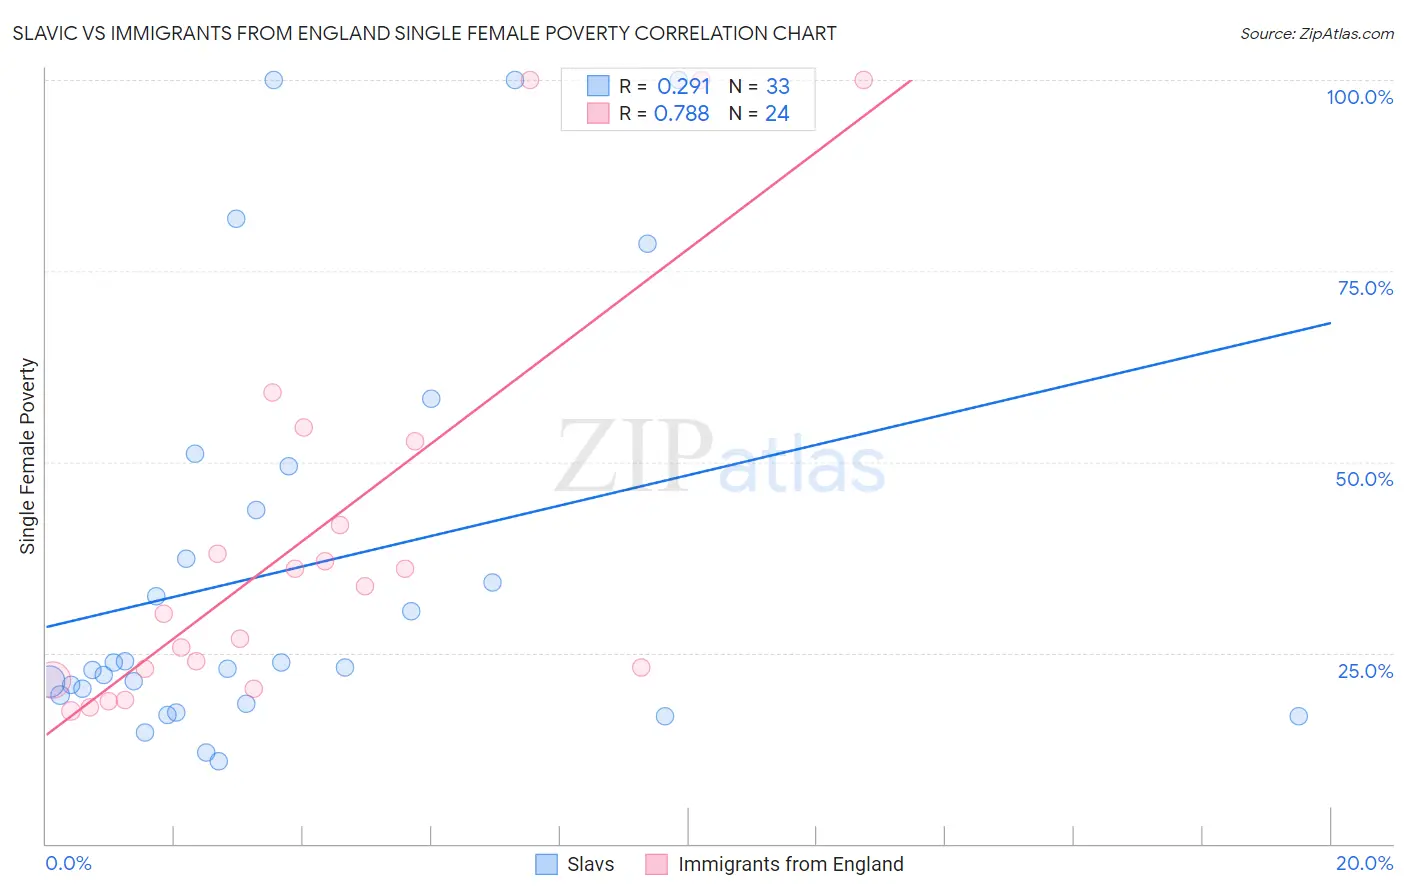
Slavic vs Immigrants from England Single Female Poverty Correlation Chart
The statistical analysis conducted on geographies consisting of 267,477,501 people shows a weak positive correlation between the proportion of Slavs and poverty level among single females in the United States with a correlation coefficient (R) of 0.291 and weighted average of 21.1%. Similarly, the statistical analysis conducted on geographies consisting of 384,642,935 people shows a strong positive correlation between the proportion of Immigrants from England and poverty level among single females in the United States with a correlation coefficient (R) of 0.788 and weighted average of 20.2%, a difference of 4.5%.
Single Female Poverty Correlation Summary
| Measurement | Slavic | Immigrants from England |
| Minimum | 10.9% | 17.4% |
| Maximum | 100.0% | 100.0% |
| Range | 89.1% | 82.6% |
| Mean | 35.9% | 39.8% |
| Median | 23.1% | 32.0% |
| Interquartile 25% (IQ1) | 18.9% | 22.2% |
| Interquartile 75% (IQ3) | 46.5% | 47.2% |
| Interquartile Range (IQR) | 27.7% | 25.0% |
| Standard Deviation (Sample) | 26.8% | 26.0% |
| Standard Deviation (Population) | 26.4% | 25.5% |
Similar Demographics by Single Female Poverty
Demographics Similar to Slavs by Single Female Poverty
In terms of single female poverty, the demographic groups most similar to Slavs are Slovak (21.1%, a difference of 0.050%), Hungarian (21.1%, a difference of 0.060%), Spanish American Indian (21.1%, a difference of 0.12%), European (21.1%, a difference of 0.12%), and British (21.1%, a difference of 0.15%).
| Demographics | Rating | Rank | Single Female Poverty |
| Czechs | 46.8 /100 | #175 | Average 21.0% |
| Canadians | 45.4 /100 | #176 | Average 21.1% |
| Scandinavians | 45.2 /100 | #177 | Average 21.1% |
| Immigrants | Bosnia and Herzegovina | 44.9 /100 | #178 | Average 21.1% |
| British | 42.9 /100 | #179 | Average 21.1% |
| Spanish American Indians | 42.5 /100 | #180 | Average 21.1% |
| Europeans | 42.3 /100 | #181 | Average 21.1% |
| Slavs | 40.5 /100 | #182 | Average 21.1% |
| Slovaks | 39.7 /100 | #183 | Fair 21.1% |
| Hungarians | 39.6 /100 | #184 | Fair 21.1% |
| Immigrants | Cambodia | 38.2 /100 | #185 | Fair 21.2% |
| Hawaiians | 37.7 /100 | #186 | Fair 21.2% |
| Immigrants | Nigeria | 36.8 /100 | #187 | Fair 21.2% |
| Yugoslavians | 35.4 /100 | #188 | Fair 21.2% |
| Immigrants | Cuba | 35.3 /100 | #189 | Fair 21.2% |
Demographics Similar to Immigrants from England by Single Female Poverty
In terms of single female poverty, the demographic groups most similar to Immigrants from England are Pakistani (20.2%, a difference of 0.030%), Uruguayan (20.2%, a difference of 0.030%), Immigrants from Hungary (20.2%, a difference of 0.090%), Immigrants from Venezuela (20.2%, a difference of 0.090%), and Immigrants from Morocco (20.2%, a difference of 0.11%).
| Demographics | Rating | Rank | Single Female Poverty |
| Serbians | 93.3 /100 | #126 | Exceptional 20.1% |
| Mongolians | 93.2 /100 | #127 | Exceptional 20.2% |
| Immigrants | Spain | 92.7 /100 | #128 | Exceptional 20.2% |
| Immigrants | Morocco | 92.4 /100 | #129 | Exceptional 20.2% |
| Immigrants | Hungary | 92.3 /100 | #130 | Exceptional 20.2% |
| Pakistanis | 92.1 /100 | #131 | Exceptional 20.2% |
| Uruguayans | 92.1 /100 | #132 | Exceptional 20.2% |
| Immigrants | England | 91.9 /100 | #133 | Exceptional 20.2% |
| Immigrants | Venezuela | 91.5 /100 | #134 | Exceptional 20.2% |
| Immigrants | Iraq | 91.2 /100 | #135 | Exceptional 20.2% |
| Immigrants | Canada | 91.2 /100 | #136 | Exceptional 20.2% |
| Immigrants | Nepal | 90.6 /100 | #137 | Exceptional 20.3% |
| Slovenes | 90.5 /100 | #138 | Exceptional 20.3% |
| Immigrants | Kuwait | 90.4 /100 | #139 | Exceptional 20.3% |
| Syrians | 90.4 /100 | #140 | Exceptional 20.3% |