Immigrants from Netherlands vs South African Single Female Poverty
COMPARE
Immigrants from Netherlands
South African
Single Female Poverty
Single Female Poverty Comparison
Immigrants from Netherlands
South Africans
20.0%
SINGLE FEMALE POVERTY
96.0/ 100
METRIC RATING
112th/ 347
METRIC RANK
20.4%
SINGLE FEMALE POVERTY
85.3/ 100
METRIC RATING
147th/ 347
METRIC RANK
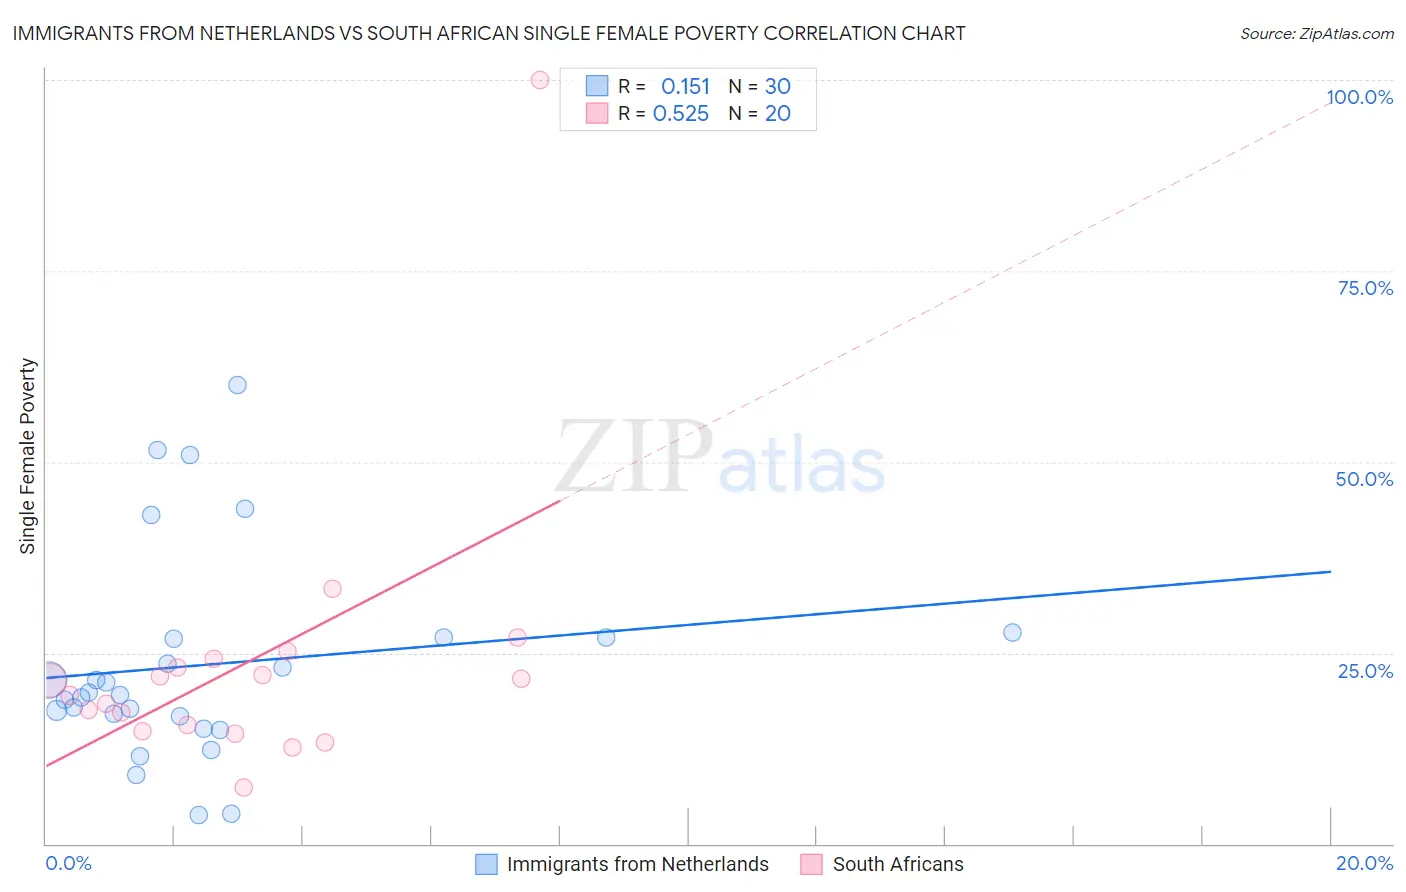
Immigrants from Netherlands vs South African Single Female Poverty Correlation Chart
The statistical analysis conducted on geographies consisting of 234,903,097 people shows a poor positive correlation between the proportion of Immigrants from Netherlands and poverty level among single females in the United States with a correlation coefficient (R) of 0.151 and weighted average of 20.0%. Similarly, the statistical analysis conducted on geographies consisting of 180,862,310 people shows a substantial positive correlation between the proportion of South Africans and poverty level among single females in the United States with a correlation coefficient (R) of 0.525 and weighted average of 20.4%, a difference of 2.3%.
Single Female Poverty Correlation Summary
| Measurement | Immigrants from Netherlands | South African |
| Minimum | 3.8% | 7.4% |
| Maximum | 60.0% | 100.0% |
| Range | 56.2% | 92.6% |
| Mean | 23.4% | 23.5% |
| Median | 19.7% | 20.4% |
| Interquartile 25% (IQ1) | 16.7% | 15.2% |
| Interquartile 75% (IQ3) | 27.0% | 23.6% |
| Interquartile Range (IQR) | 10.4% | 8.4% |
| Standard Deviation (Sample) | 13.6% | 18.9% |
| Standard Deviation (Population) | 13.4% | 18.4% |
Similar Demographics by Single Female Poverty
Demographics Similar to Immigrants from Netherlands by Single Female Poverty
In terms of single female poverty, the demographic groups most similar to Immigrants from Netherlands are Immigrants from Zimbabwe (20.0%, a difference of 0.050%), Carpatho Rusyn (20.0%, a difference of 0.060%), Immigrants from Colombia (20.0%, a difference of 0.060%), Immigrants from Northern Africa (20.0%, a difference of 0.070%), and Immigrants from Kazakhstan (20.0%, a difference of 0.11%).
| Demographics | Rating | Rank | Single Female Poverty |
| Israelis | 96.9 /100 | #105 | Exceptional 19.9% |
| Ethiopians | 96.7 /100 | #106 | Exceptional 19.9% |
| Immigrants | Syria | 96.7 /100 | #107 | Exceptional 19.9% |
| Native Hawaiians | 96.6 /100 | #108 | Exceptional 19.9% |
| Colombians | 96.6 /100 | #109 | Exceptional 19.9% |
| Immigrants | Western Asia | 96.5 /100 | #110 | Exceptional 19.9% |
| Carpatho Rusyns | 96.1 /100 | #111 | Exceptional 20.0% |
| Immigrants | Netherlands | 96.0 /100 | #112 | Exceptional 20.0% |
| Immigrants | Zimbabwe | 95.9 /100 | #113 | Exceptional 20.0% |
| Immigrants | Colombia | 95.9 /100 | #114 | Exceptional 20.0% |
| Immigrants | Northern Africa | 95.8 /100 | #115 | Exceptional 20.0% |
| Immigrants | Kazakhstan | 95.7 /100 | #116 | Exceptional 20.0% |
| Poles | 95.6 /100 | #117 | Exceptional 20.0% |
| Immigrants | Afghanistan | 95.4 /100 | #118 | Exceptional 20.0% |
| Immigrants | Ethiopia | 95.4 /100 | #119 | Exceptional 20.0% |
Demographics Similar to South Africans by Single Female Poverty
In terms of single female poverty, the demographic groups most similar to South Africans are Venezuelan (20.4%, a difference of 0.030%), Luxembourger (20.4%, a difference of 0.050%), Austrian (20.4%, a difference of 0.060%), Immigrants from Uzbekistan (20.3%, a difference of 0.42%), and Australian (20.3%, a difference of 0.43%).
| Demographics | Rating | Rank | Single Female Poverty |
| Syrians | 90.4 /100 | #140 | Exceptional 20.3% |
| Immigrants | North America | 89.5 /100 | #141 | Excellent 20.3% |
| Immigrants | Uganda | 89.1 /100 | #142 | Excellent 20.3% |
| Australians | 88.4 /100 | #143 | Excellent 20.3% |
| Immigrants | Uzbekistan | 88.3 /100 | #144 | Excellent 20.3% |
| Austrians | 85.8 /100 | #145 | Excellent 20.4% |
| Venezuelans | 85.5 /100 | #146 | Excellent 20.4% |
| South Africans | 85.3 /100 | #147 | Excellent 20.4% |
| Luxembourgers | 84.9 /100 | #148 | Excellent 20.4% |
| Portuguese | 81.5 /100 | #149 | Excellent 20.5% |
| Immigrants | Denmark | 80.5 /100 | #150 | Excellent 20.5% |
| Puget Sound Salish | 79.6 /100 | #151 | Good 20.6% |
| Immigrants | Uruguay | 77.7 /100 | #152 | Good 20.6% |
| Swedes | 77.1 /100 | #153 | Good 20.6% |
| Immigrants | Western Europe | 76.7 /100 | #154 | Good 20.6% |