Immigrants from Hong Kong vs South African Single Female Poverty
COMPARE
Immigrants from Hong Kong
South African
Single Female Poverty
Single Female Poverty Comparison
Immigrants from Hong Kong
South Africans
16.5%
SINGLE FEMALE POVERTY
100.0/ 100
METRIC RATING
3rd/ 347
METRIC RANK
20.4%
SINGLE FEMALE POVERTY
85.3/ 100
METRIC RATING
147th/ 347
METRIC RANK
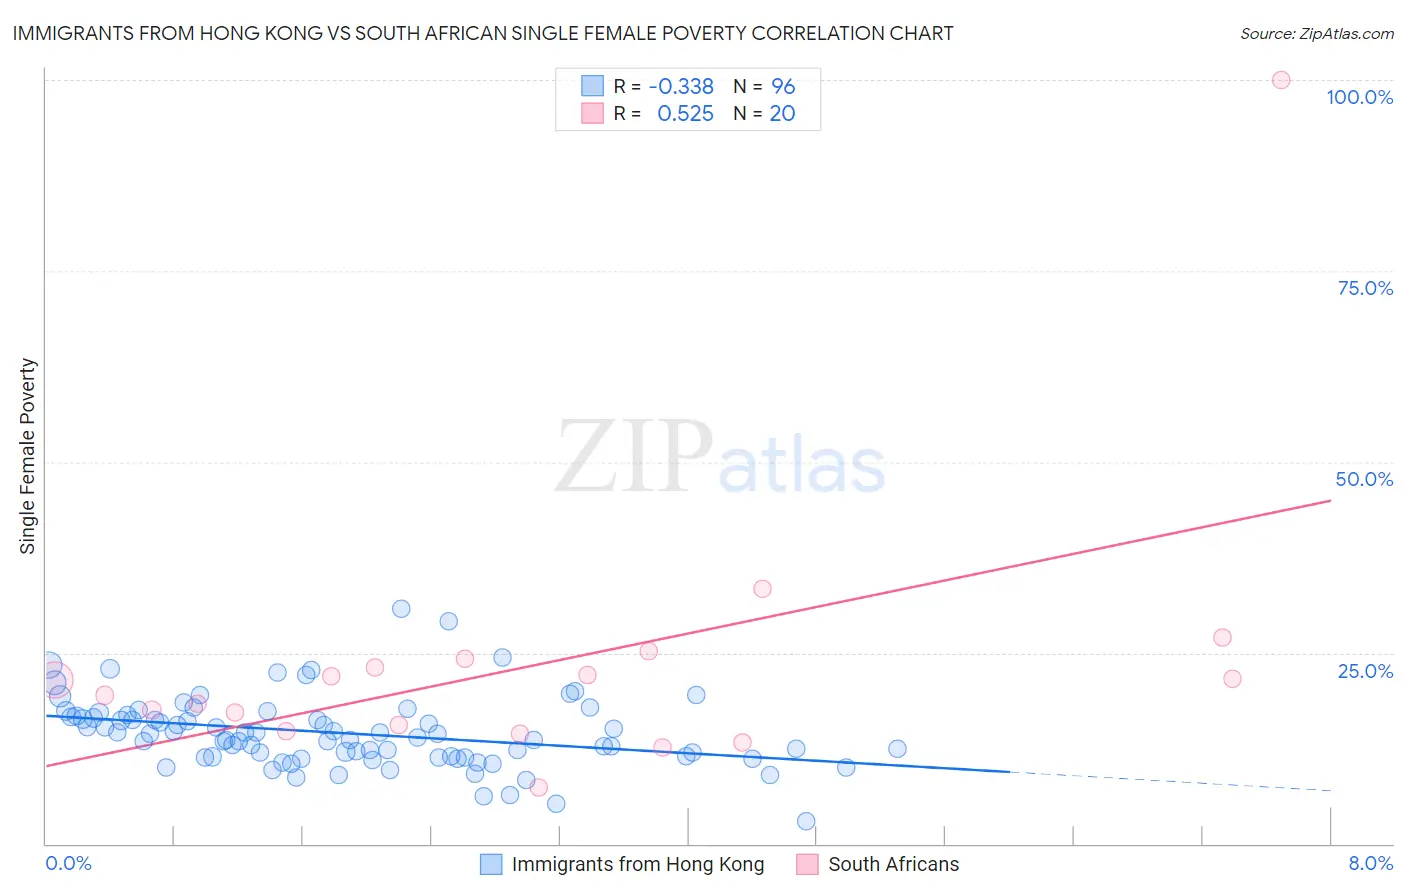
Immigrants from Hong Kong vs South African Single Female Poverty Correlation Chart
The statistical analysis conducted on geographies consisting of 250,865,263 people shows a mild negative correlation between the proportion of Immigrants from Hong Kong and poverty level among single females in the United States with a correlation coefficient (R) of -0.338 and weighted average of 16.5%. Similarly, the statistical analysis conducted on geographies consisting of 180,862,310 people shows a substantial positive correlation between the proportion of South Africans and poverty level among single females in the United States with a correlation coefficient (R) of 0.525 and weighted average of 20.4%, a difference of 23.6%.
Single Female Poverty Correlation Summary
| Measurement | Immigrants from Hong Kong | South African |
| Minimum | 2.9% | 7.4% |
| Maximum | 30.8% | 100.0% |
| Range | 27.8% | 92.6% |
| Mean | 14.5% | 23.5% |
| Median | 14.1% | 20.4% |
| Interquartile 25% (IQ1) | 11.3% | 15.2% |
| Interquartile 75% (IQ3) | 16.7% | 23.6% |
| Interquartile Range (IQR) | 5.3% | 8.4% |
| Standard Deviation (Sample) | 4.6% | 18.9% |
| Standard Deviation (Population) | 4.6% | 18.4% |
Similar Demographics by Single Female Poverty
Demographics Similar to Immigrants from Hong Kong by Single Female Poverty
In terms of single female poverty, the demographic groups most similar to Immigrants from Hong Kong are Immigrants from Taiwan (16.4%, a difference of 1.1%), Immigrants from India (16.8%, a difference of 1.7%), Chinese (16.1%, a difference of 2.4%), Assyrian/Chaldean/Syriac (17.0%, a difference of 2.6%), and Filipino (17.0%, a difference of 2.8%).
| Demographics | Rating | Rank | Single Female Poverty |
| Chinese | 100.0 /100 | #1 | Exceptional 16.1% |
| Immigrants | Taiwan | 100.0 /100 | #2 | Exceptional 16.4% |
| Immigrants | Hong Kong | 100.0 /100 | #3 | Exceptional 16.5% |
| Immigrants | India | 100.0 /100 | #4 | Exceptional 16.8% |
| Assyrians/Chaldeans/Syriacs | 100.0 /100 | #5 | Exceptional 17.0% |
| Filipinos | 100.0 /100 | #6 | Exceptional 17.0% |
| Thais | 100.0 /100 | #7 | Exceptional 17.3% |
| Immigrants | Iran | 100.0 /100 | #8 | Exceptional 17.5% |
| Bhutanese | 100.0 /100 | #9 | Exceptional 17.7% |
| Immigrants | Ireland | 100.0 /100 | #10 | Exceptional 17.8% |
| Immigrants | Lithuania | 100.0 /100 | #11 | Exceptional 17.8% |
| Immigrants | South Central Asia | 100.0 /100 | #12 | Exceptional 17.8% |
| Immigrants | Bolivia | 100.0 /100 | #13 | Exceptional 17.8% |
| Bolivians | 100.0 /100 | #14 | Exceptional 17.9% |
| Indians (Asian) | 100.0 /100 | #15 | Exceptional 17.9% |
Demographics Similar to South Africans by Single Female Poverty
In terms of single female poverty, the demographic groups most similar to South Africans are Venezuelan (20.4%, a difference of 0.030%), Luxembourger (20.4%, a difference of 0.050%), Austrian (20.4%, a difference of 0.060%), Immigrants from Uzbekistan (20.3%, a difference of 0.42%), and Australian (20.3%, a difference of 0.43%).
| Demographics | Rating | Rank | Single Female Poverty |
| Syrians | 90.4 /100 | #140 | Exceptional 20.3% |
| Immigrants | North America | 89.5 /100 | #141 | Excellent 20.3% |
| Immigrants | Uganda | 89.1 /100 | #142 | Excellent 20.3% |
| Australians | 88.4 /100 | #143 | Excellent 20.3% |
| Immigrants | Uzbekistan | 88.3 /100 | #144 | Excellent 20.3% |
| Austrians | 85.8 /100 | #145 | Excellent 20.4% |
| Venezuelans | 85.5 /100 | #146 | Excellent 20.4% |
| South Africans | 85.3 /100 | #147 | Excellent 20.4% |
| Luxembourgers | 84.9 /100 | #148 | Excellent 20.4% |
| Portuguese | 81.5 /100 | #149 | Excellent 20.5% |
| Immigrants | Denmark | 80.5 /100 | #150 | Excellent 20.5% |
| Puget Sound Salish | 79.6 /100 | #151 | Good 20.6% |
| Immigrants | Uruguay | 77.7 /100 | #152 | Good 20.6% |
| Swedes | 77.1 /100 | #153 | Good 20.6% |
| Immigrants | Western Europe | 76.7 /100 | #154 | Good 20.6% |