Slavic vs Seminole Single Female Poverty
COMPARE
Slavic
Seminole
Single Female Poverty
Single Female Poverty Comparison
Slavs
Seminole
21.1%
SINGLE FEMALE POVERTY
40.5/ 100
METRIC RATING
182nd/ 347
METRIC RANK
26.8%
SINGLE FEMALE POVERTY
0.0/ 100
METRIC RATING
322nd/ 347
METRIC RANK
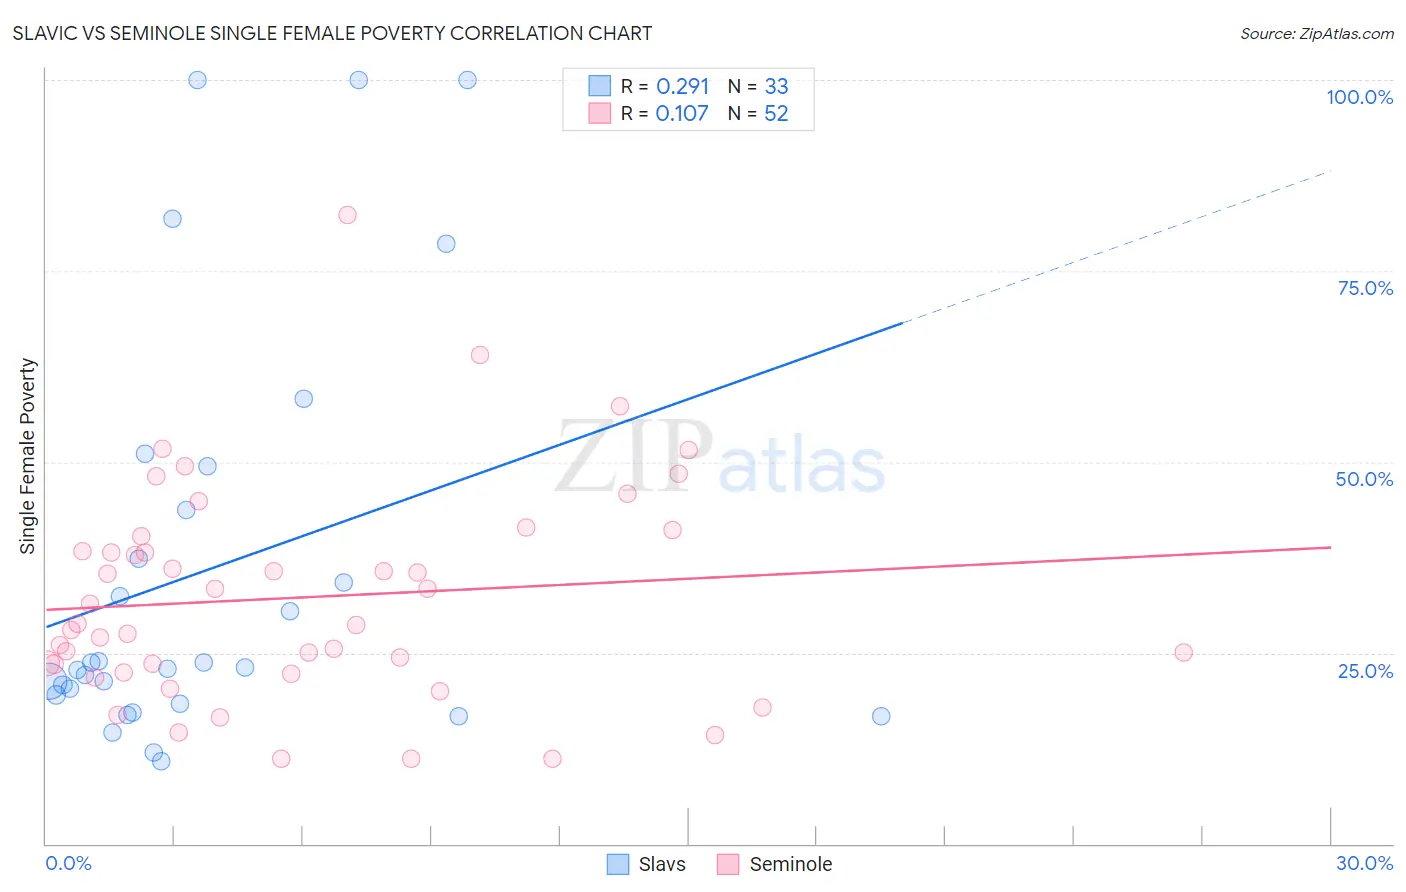
Slavic vs Seminole Single Female Poverty Correlation Chart
The statistical analysis conducted on geographies consisting of 267,477,501 people shows a weak positive correlation between the proportion of Slavs and poverty level among single females in the United States with a correlation coefficient (R) of 0.291 and weighted average of 21.1%. Similarly, the statistical analysis conducted on geographies consisting of 117,983,009 people shows a poor positive correlation between the proportion of Seminole and poverty level among single females in the United States with a correlation coefficient (R) of 0.107 and weighted average of 26.8%, a difference of 26.8%.
Single Female Poverty Correlation Summary
| Measurement | Slavic | Seminole |
| Minimum | 10.9% | 11.1% |
| Maximum | 100.0% | 82.4% |
| Range | 89.1% | 71.2% |
| Mean | 35.9% | 32.3% |
| Median | 23.1% | 28.7% |
| Interquartile 25% (IQ1) | 18.9% | 23.0% |
| Interquartile 75% (IQ3) | 46.5% | 39.2% |
| Interquartile Range (IQR) | 27.7% | 16.2% |
| Standard Deviation (Sample) | 26.8% | 14.2% |
| Standard Deviation (Population) | 26.4% | 14.1% |
Similar Demographics by Single Female Poverty
Demographics Similar to Slavs by Single Female Poverty
In terms of single female poverty, the demographic groups most similar to Slavs are Slovak (21.1%, a difference of 0.050%), Hungarian (21.1%, a difference of 0.060%), Spanish American Indian (21.1%, a difference of 0.12%), European (21.1%, a difference of 0.12%), and British (21.1%, a difference of 0.15%).
| Demographics | Rating | Rank | Single Female Poverty |
| Czechs | 46.8 /100 | #175 | Average 21.0% |
| Canadians | 45.4 /100 | #176 | Average 21.1% |
| Scandinavians | 45.2 /100 | #177 | Average 21.1% |
| Immigrants | Bosnia and Herzegovina | 44.9 /100 | #178 | Average 21.1% |
| British | 42.9 /100 | #179 | Average 21.1% |
| Spanish American Indians | 42.5 /100 | #180 | Average 21.1% |
| Europeans | 42.3 /100 | #181 | Average 21.1% |
| Slavs | 40.5 /100 | #182 | Average 21.1% |
| Slovaks | 39.7 /100 | #183 | Fair 21.1% |
| Hungarians | 39.6 /100 | #184 | Fair 21.1% |
| Immigrants | Cambodia | 38.2 /100 | #185 | Fair 21.2% |
| Hawaiians | 37.7 /100 | #186 | Fair 21.2% |
| Immigrants | Nigeria | 36.8 /100 | #187 | Fair 21.2% |
| Yugoslavians | 35.4 /100 | #188 | Fair 21.2% |
| Immigrants | Cuba | 35.3 /100 | #189 | Fair 21.2% |
Demographics Similar to Seminole by Single Female Poverty
In terms of single female poverty, the demographic groups most similar to Seminole are Chippewa (26.8%, a difference of 0.10%), Kiowa (26.9%, a difference of 0.52%), Yup'ik (26.6%, a difference of 0.74%), Arapaho (26.4%, a difference of 1.4%), and Choctaw (27.2%, a difference of 1.5%).
| Demographics | Rating | Rank | Single Female Poverty |
| Iroquois | 0.0 /100 | #315 | Tragic 25.7% |
| Immigrants | Somalia | 0.0 /100 | #316 | Tragic 25.8% |
| Ottawa | 0.0 /100 | #317 | Tragic 26.0% |
| Chickasaw | 0.0 /100 | #318 | Tragic 26.3% |
| Blacks/African Americans | 0.0 /100 | #319 | Tragic 26.4% |
| Arapaho | 0.0 /100 | #320 | Tragic 26.4% |
| Yup'ik | 0.0 /100 | #321 | Tragic 26.6% |
| Seminole | 0.0 /100 | #322 | Tragic 26.8% |
| Chippewa | 0.0 /100 | #323 | Tragic 26.8% |
| Kiowa | 0.0 /100 | #324 | Tragic 26.9% |
| Choctaw | 0.0 /100 | #325 | Tragic 27.2% |
| Creek | 0.0 /100 | #326 | Tragic 27.4% |
| Dutch West Indians | 0.0 /100 | #327 | Tragic 27.5% |
| Apache | 0.0 /100 | #328 | Tragic 27.7% |
| Menominee | 0.0 /100 | #329 | Tragic 27.8% |