Slavic vs Immigrants from Eritrea Single Female Poverty
COMPARE
Slavic
Immigrants from Eritrea
Single Female Poverty
Single Female Poverty Comparison
Slavs
Immigrants from Eritrea
21.1%
SINGLE FEMALE POVERTY
40.5/ 100
METRIC RATING
182nd/ 347
METRIC RANK
21.8%
SINGLE FEMALE POVERTY
7.9/ 100
METRIC RATING
222nd/ 347
METRIC RANK
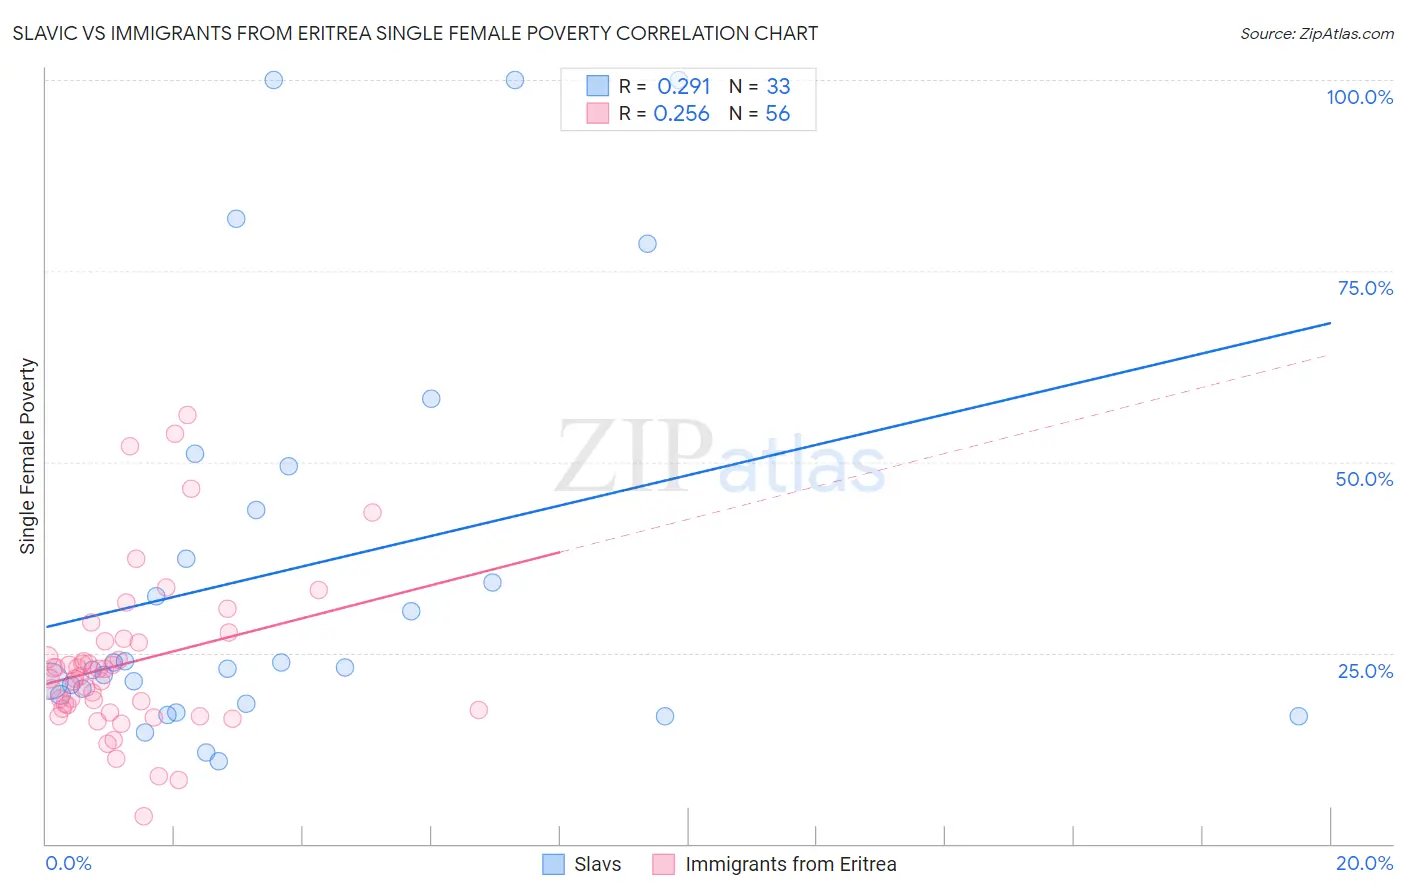
Slavic vs Immigrants from Eritrea Single Female Poverty Correlation Chart
The statistical analysis conducted on geographies consisting of 267,477,501 people shows a weak positive correlation between the proportion of Slavs and poverty level among single females in the United States with a correlation coefficient (R) of 0.291 and weighted average of 21.1%. Similarly, the statistical analysis conducted on geographies consisting of 104,658,207 people shows a weak positive correlation between the proportion of Immigrants from Eritrea and poverty level among single females in the United States with a correlation coefficient (R) of 0.256 and weighted average of 21.8%, a difference of 3.2%.
Single Female Poverty Correlation Summary
| Measurement | Slavic | Immigrants from Eritrea |
| Minimum | 10.9% | 3.5% |
| Maximum | 100.0% | 56.2% |
| Range | 89.1% | 52.6% |
| Mean | 35.9% | 23.7% |
| Median | 23.1% | 21.8% |
| Interquartile 25% (IQ1) | 18.9% | 17.6% |
| Interquartile 75% (IQ3) | 46.5% | 26.4% |
| Interquartile Range (IQR) | 27.7% | 8.8% |
| Standard Deviation (Sample) | 26.8% | 10.5% |
| Standard Deviation (Population) | 26.4% | 10.4% |
Similar Demographics by Single Female Poverty
Demographics Similar to Slavs by Single Female Poverty
In terms of single female poverty, the demographic groups most similar to Slavs are Slovak (21.1%, a difference of 0.050%), Hungarian (21.1%, a difference of 0.060%), Spanish American Indian (21.1%, a difference of 0.12%), European (21.1%, a difference of 0.12%), and British (21.1%, a difference of 0.15%).
| Demographics | Rating | Rank | Single Female Poverty |
| Czechs | 46.8 /100 | #175 | Average 21.0% |
| Canadians | 45.4 /100 | #176 | Average 21.1% |
| Scandinavians | 45.2 /100 | #177 | Average 21.1% |
| Immigrants | Bosnia and Herzegovina | 44.9 /100 | #178 | Average 21.1% |
| British | 42.9 /100 | #179 | Average 21.1% |
| Spanish American Indians | 42.5 /100 | #180 | Average 21.1% |
| Europeans | 42.3 /100 | #181 | Average 21.1% |
| Slavs | 40.5 /100 | #182 | Average 21.1% |
| Slovaks | 39.7 /100 | #183 | Fair 21.1% |
| Hungarians | 39.6 /100 | #184 | Fair 21.1% |
| Immigrants | Cambodia | 38.2 /100 | #185 | Fair 21.2% |
| Hawaiians | 37.7 /100 | #186 | Fair 21.2% |
| Immigrants | Nigeria | 36.8 /100 | #187 | Fair 21.2% |
| Yugoslavians | 35.4 /100 | #188 | Fair 21.2% |
| Immigrants | Cuba | 35.3 /100 | #189 | Fair 21.2% |
Demographics Similar to Immigrants from Eritrea by Single Female Poverty
In terms of single female poverty, the demographic groups most similar to Immigrants from Eritrea are Immigrants from Grenada (21.8%, a difference of 0.010%), German (21.8%, a difference of 0.070%), Scottish (21.8%, a difference of 0.14%), Barbadian (21.8%, a difference of 0.16%), and Panamanian (21.7%, a difference of 0.27%).
| Demographics | Rating | Rank | Single Female Poverty |
| Ecuadorians | 12.3 /100 | #215 | Poor 21.6% |
| Immigrants | Barbados | 12.2 /100 | #216 | Poor 21.7% |
| Immigrants | St. Vincent and the Grenadines | 11.7 /100 | #217 | Poor 21.7% |
| Nepalese | 9.7 /100 | #218 | Tragic 21.7% |
| Panamanians | 9.4 /100 | #219 | Tragic 21.7% |
| Germans | 8.3 /100 | #220 | Tragic 21.8% |
| Immigrants | Grenada | 8.0 /100 | #221 | Tragic 21.8% |
| Immigrants | Eritrea | 7.9 /100 | #222 | Tragic 21.8% |
| Scottish | 7.3 /100 | #223 | Tragic 21.8% |
| Barbadians | 7.2 /100 | #224 | Tragic 21.8% |
| English | 6.4 /100 | #225 | Tragic 21.9% |
| Immigrants | Portugal | 5.8 /100 | #226 | Tragic 21.9% |
| Immigrants | Ghana | 5.8 /100 | #227 | Tragic 21.9% |
| Salvadorans | 5.5 /100 | #228 | Tragic 21.9% |
| Tlingit-Haida | 5.4 /100 | #229 | Tragic 21.9% |