Slavic vs Sierra Leonean Single Female Poverty
COMPARE
Slavic
Sierra Leonean
Single Female Poverty
Single Female Poverty Comparison
Slavs
Sierra Leoneans
21.1%
SINGLE FEMALE POVERTY
40.5/ 100
METRIC RATING
182nd/ 347
METRIC RANK
19.7%
SINGLE FEMALE POVERTY
97.9/ 100
METRIC RATING
99th/ 347
METRIC RANK
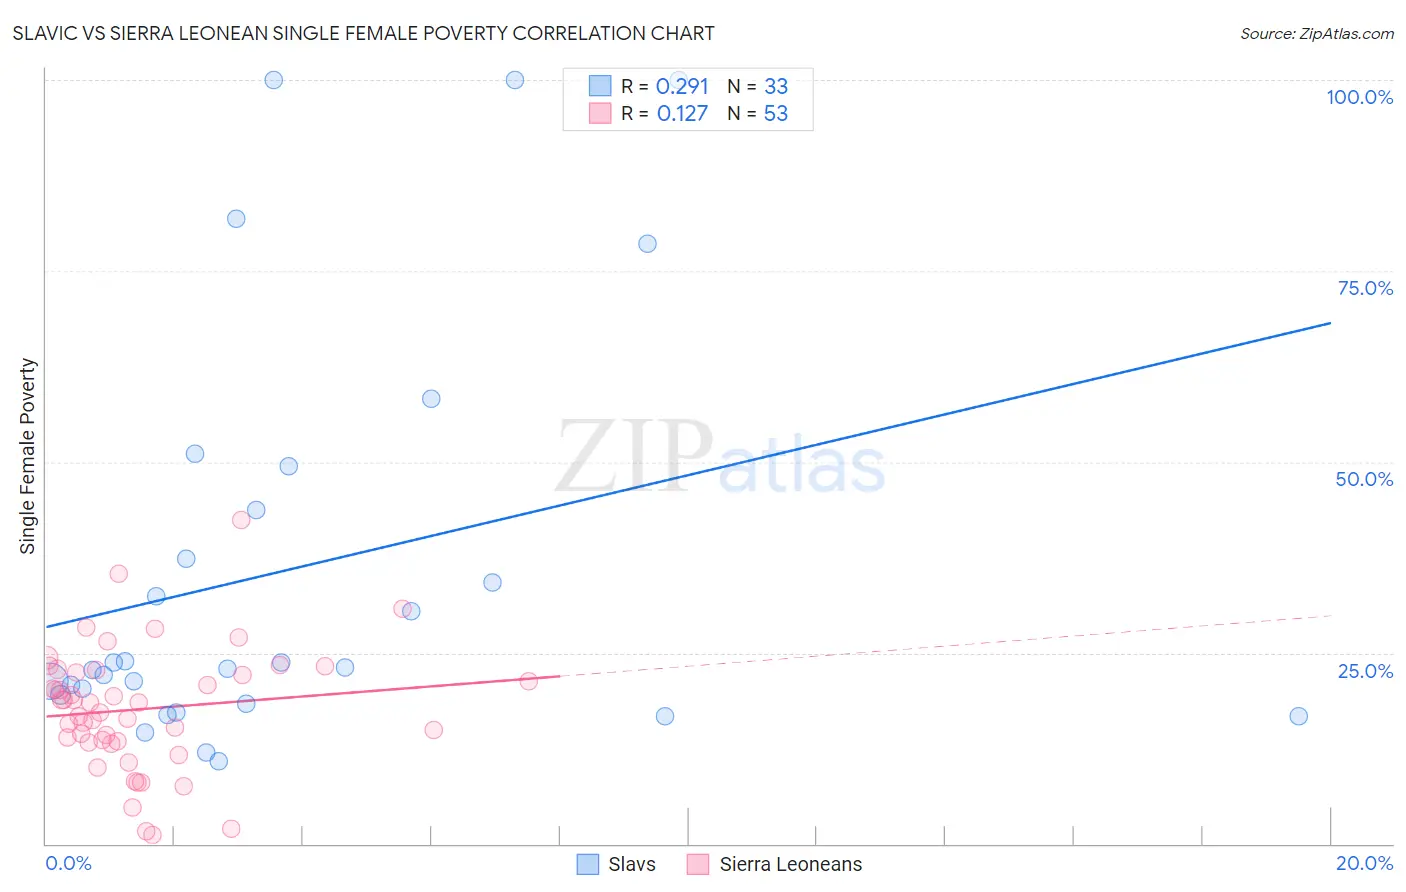
Slavic vs Sierra Leonean Single Female Poverty Correlation Chart
The statistical analysis conducted on geographies consisting of 267,477,501 people shows a weak positive correlation between the proportion of Slavs and poverty level among single females in the United States with a correlation coefficient (R) of 0.291 and weighted average of 21.1%. Similarly, the statistical analysis conducted on geographies consisting of 83,185,885 people shows a poor positive correlation between the proportion of Sierra Leoneans and poverty level among single females in the United States with a correlation coefficient (R) of 0.127 and weighted average of 19.7%, a difference of 7.0%.
Single Female Poverty Correlation Summary
| Measurement | Slavic | Sierra Leonean |
| Minimum | 10.9% | 1.1% |
| Maximum | 100.0% | 42.4% |
| Range | 89.1% | 41.2% |
| Mean | 35.9% | 17.6% |
| Median | 23.1% | 18.6% |
| Interquartile 25% (IQ1) | 18.9% | 13.4% |
| Interquartile 75% (IQ3) | 46.5% | 22.5% |
| Interquartile Range (IQR) | 27.7% | 9.2% |
| Standard Deviation (Sample) | 26.8% | 8.1% |
| Standard Deviation (Population) | 26.4% | 8.0% |
Similar Demographics by Single Female Poverty
Demographics Similar to Slavs by Single Female Poverty
In terms of single female poverty, the demographic groups most similar to Slavs are Slovak (21.1%, a difference of 0.050%), Hungarian (21.1%, a difference of 0.060%), Spanish American Indian (21.1%, a difference of 0.12%), European (21.1%, a difference of 0.12%), and British (21.1%, a difference of 0.15%).
| Demographics | Rating | Rank | Single Female Poverty |
| Czechs | 46.8 /100 | #175 | Average 21.0% |
| Canadians | 45.4 /100 | #176 | Average 21.1% |
| Scandinavians | 45.2 /100 | #177 | Average 21.1% |
| Immigrants | Bosnia and Herzegovina | 44.9 /100 | #178 | Average 21.1% |
| British | 42.9 /100 | #179 | Average 21.1% |
| Spanish American Indians | 42.5 /100 | #180 | Average 21.1% |
| Europeans | 42.3 /100 | #181 | Average 21.1% |
| Slavs | 40.5 /100 | #182 | Average 21.1% |
| Slovaks | 39.7 /100 | #183 | Fair 21.1% |
| Hungarians | 39.6 /100 | #184 | Fair 21.1% |
| Immigrants | Cambodia | 38.2 /100 | #185 | Fair 21.2% |
| Hawaiians | 37.7 /100 | #186 | Fair 21.2% |
| Immigrants | Nigeria | 36.8 /100 | #187 | Fair 21.2% |
| Yugoslavians | 35.4 /100 | #188 | Fair 21.2% |
| Immigrants | Cuba | 35.3 /100 | #189 | Fair 21.2% |
Demographics Similar to Sierra Leoneans by Single Female Poverty
In terms of single female poverty, the demographic groups most similar to Sierra Leoneans are Immigrants from France (19.7%, a difference of 0.010%), Croatian (19.7%, a difference of 0.14%), Immigrants from Brazil (19.7%, a difference of 0.23%), Ukrainian (19.8%, a difference of 0.25%), and Estonian (19.7%, a difference of 0.28%).
| Demographics | Rating | Rank | Single Female Poverty |
| Italians | 98.8 /100 | #92 | Exceptional 19.6% |
| Immigrants | Austria | 98.8 /100 | #93 | Exceptional 19.6% |
| Romanians | 98.6 /100 | #94 | Exceptional 19.6% |
| Estonians | 98.2 /100 | #95 | Exceptional 19.7% |
| Immigrants | Brazil | 98.2 /100 | #96 | Exceptional 19.7% |
| Croatians | 98.1 /100 | #97 | Exceptional 19.7% |
| Immigrants | France | 97.9 /100 | #98 | Exceptional 19.7% |
| Sierra Leoneans | 97.9 /100 | #99 | Exceptional 19.7% |
| Ukrainians | 97.6 /100 | #100 | Exceptional 19.8% |
| Immigrants | Belgium | 97.3 /100 | #101 | Exceptional 19.8% |
| Immigrants | Cameroon | 97.3 /100 | #102 | Exceptional 19.8% |
| Immigrants | Southern Europe | 97.1 /100 | #103 | Exceptional 19.9% |
| Chileans | 96.9 /100 | #104 | Exceptional 19.9% |
| Israelis | 96.9 /100 | #105 | Exceptional 19.9% |
| Ethiopians | 96.7 /100 | #106 | Exceptional 19.9% |