Slavic vs Sudanese Single Female Poverty
COMPARE
Slavic
Sudanese
Single Female Poverty
Single Female Poverty Comparison
Slavs
Sudanese
21.1%
SINGLE FEMALE POVERTY
40.5/ 100
METRIC RATING
182nd/ 347
METRIC RANK
22.6%
SINGLE FEMALE POVERTY
0.7/ 100
METRIC RATING
257th/ 347
METRIC RANK
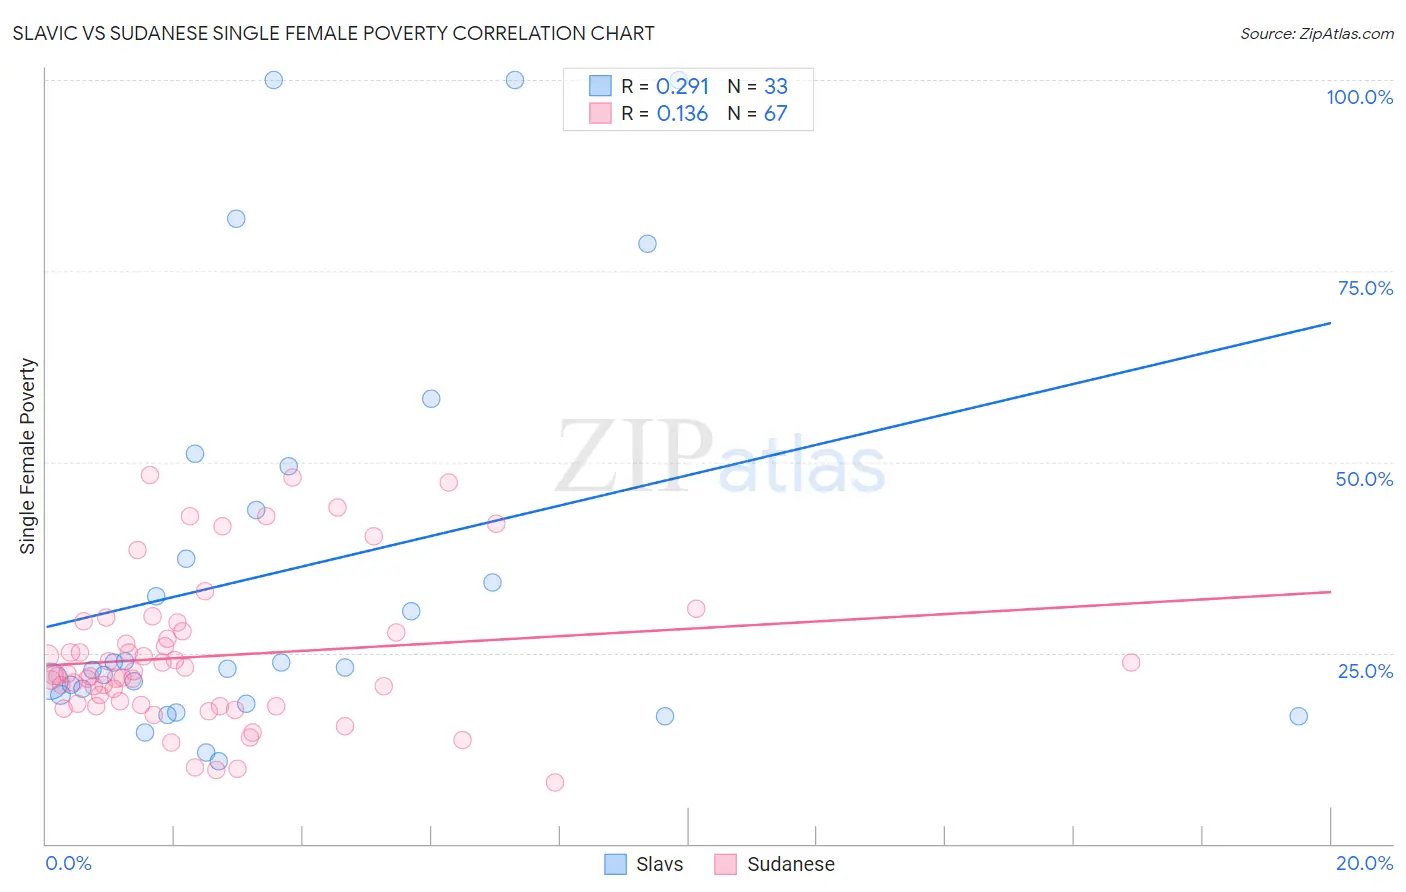
Slavic vs Sudanese Single Female Poverty Correlation Chart
The statistical analysis conducted on geographies consisting of 267,477,501 people shows a weak positive correlation between the proportion of Slavs and poverty level among single females in the United States with a correlation coefficient (R) of 0.291 and weighted average of 21.1%. Similarly, the statistical analysis conducted on geographies consisting of 109,775,287 people shows a poor positive correlation between the proportion of Sudanese and poverty level among single females in the United States with a correlation coefficient (R) of 0.136 and weighted average of 22.6%, a difference of 7.1%.
Single Female Poverty Correlation Summary
| Measurement | Slavic | Sudanese |
| Minimum | 10.9% | 8.0% |
| Maximum | 100.0% | 48.2% |
| Range | 89.1% | 40.2% |
| Mean | 35.9% | 24.5% |
| Median | 23.1% | 22.1% |
| Interquartile 25% (IQ1) | 18.9% | 18.2% |
| Interquartile 75% (IQ3) | 46.5% | 27.9% |
| Interquartile Range (IQR) | 27.7% | 9.7% |
| Standard Deviation (Sample) | 26.8% | 9.6% |
| Standard Deviation (Population) | 26.4% | 9.5% |
Similar Demographics by Single Female Poverty
Demographics Similar to Slavs by Single Female Poverty
In terms of single female poverty, the demographic groups most similar to Slavs are Slovak (21.1%, a difference of 0.050%), Hungarian (21.1%, a difference of 0.060%), Spanish American Indian (21.1%, a difference of 0.12%), European (21.1%, a difference of 0.12%), and British (21.1%, a difference of 0.15%).
| Demographics | Rating | Rank | Single Female Poverty |
| Czechs | 46.8 /100 | #175 | Average 21.0% |
| Canadians | 45.4 /100 | #176 | Average 21.1% |
| Scandinavians | 45.2 /100 | #177 | Average 21.1% |
| Immigrants | Bosnia and Herzegovina | 44.9 /100 | #178 | Average 21.1% |
| British | 42.9 /100 | #179 | Average 21.1% |
| Spanish American Indians | 42.5 /100 | #180 | Average 21.1% |
| Europeans | 42.3 /100 | #181 | Average 21.1% |
| Slavs | 40.5 /100 | #182 | Average 21.1% |
| Slovaks | 39.7 /100 | #183 | Fair 21.1% |
| Hungarians | 39.6 /100 | #184 | Fair 21.1% |
| Immigrants | Cambodia | 38.2 /100 | #185 | Fair 21.2% |
| Hawaiians | 37.7 /100 | #186 | Fair 21.2% |
| Immigrants | Nigeria | 36.8 /100 | #187 | Fair 21.2% |
| Yugoslavians | 35.4 /100 | #188 | Fair 21.2% |
| Immigrants | Cuba | 35.3 /100 | #189 | Fair 21.2% |
Demographics Similar to Sudanese by Single Female Poverty
In terms of single female poverty, the demographic groups most similar to Sudanese are Immigrants from Belize (22.6%, a difference of 0.14%), Bahamian (22.7%, a difference of 0.20%), Immigrants from Burma/Myanmar (22.6%, a difference of 0.29%), Immigrants from Sudan (22.6%, a difference of 0.29%), and White/Caucasian (22.7%, a difference of 0.34%).
| Demographics | Rating | Rank | Single Female Poverty |
| Immigrants | Bahamas | 1.2 /100 | #250 | Tragic 22.5% |
| Immigrants | West Indies | 1.0 /100 | #251 | Tragic 22.5% |
| Delaware | 1.0 /100 | #252 | Tragic 22.5% |
| Immigrants | Liberia | 0.9 /100 | #253 | Tragic 22.5% |
| Immigrants | Burma/Myanmar | 0.8 /100 | #254 | Tragic 22.6% |
| Immigrants | Sudan | 0.8 /100 | #255 | Tragic 22.6% |
| Immigrants | Belize | 0.8 /100 | #256 | Tragic 22.6% |
| Sudanese | 0.7 /100 | #257 | Tragic 22.6% |
| Bahamians | 0.6 /100 | #258 | Tragic 22.7% |
| Whites/Caucasians | 0.6 /100 | #259 | Tragic 22.7% |
| Celtics | 0.5 /100 | #260 | Tragic 22.7% |
| Immigrants | Cabo Verde | 0.4 /100 | #261 | Tragic 22.8% |
| British West Indians | 0.4 /100 | #262 | Tragic 22.8% |
| Scotch-Irish | 0.3 /100 | #263 | Tragic 22.9% |
| Immigrants | Laos | 0.3 /100 | #264 | Tragic 22.9% |