Serbian vs Celtic Single Female Poverty
COMPARE
Serbian
Celtic
Single Female Poverty
Single Female Poverty Comparison
Serbians
Celtics
20.1%
SINGLE FEMALE POVERTY
93.3/ 100
METRIC RATING
126th/ 347
METRIC RANK
22.7%
SINGLE FEMALE POVERTY
0.5/ 100
METRIC RATING
260th/ 347
METRIC RANK
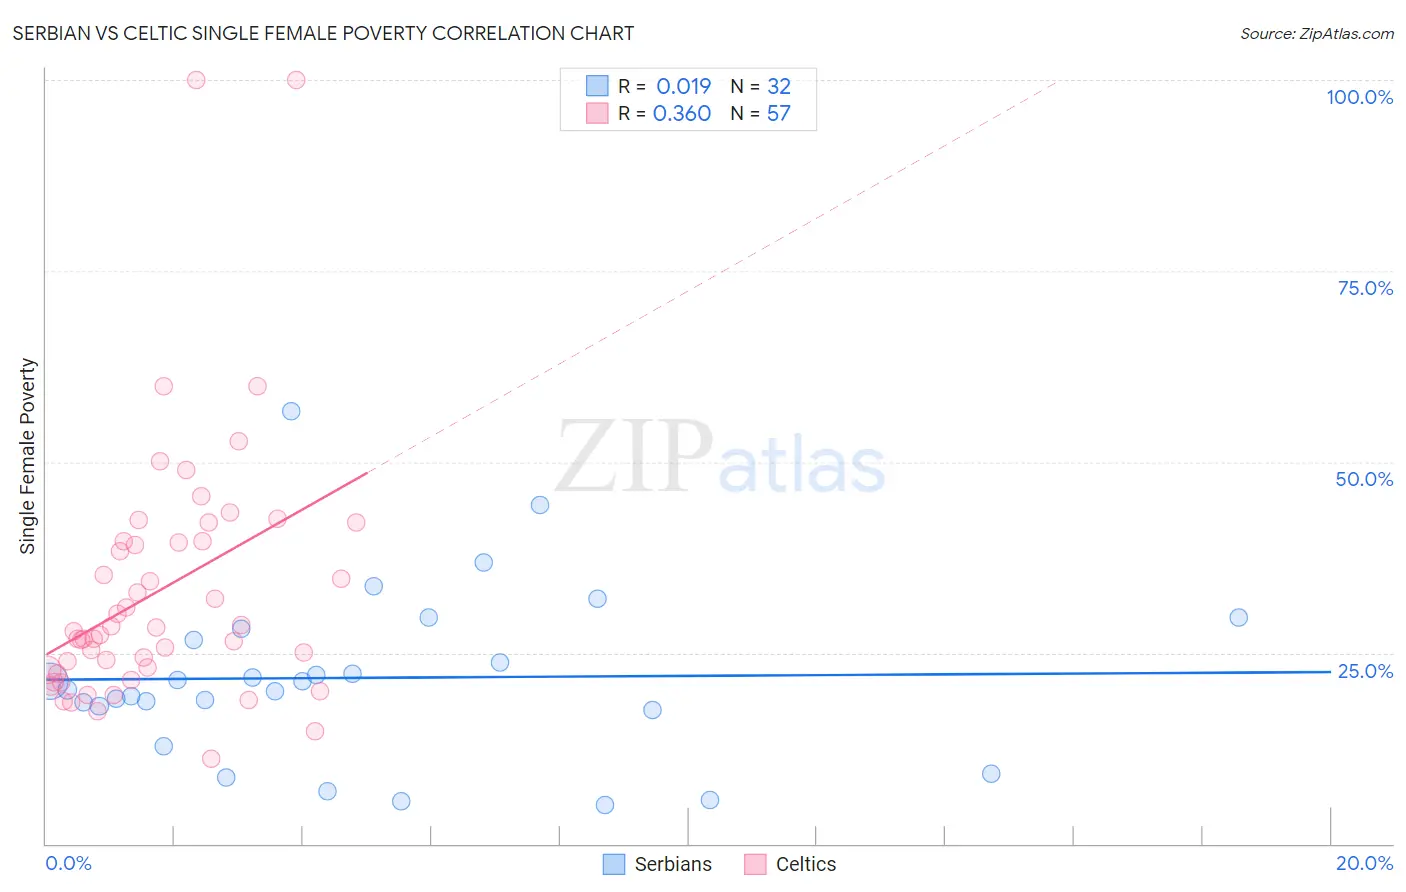
Serbian vs Celtic Single Female Poverty Correlation Chart
The statistical analysis conducted on geographies consisting of 264,350,230 people shows no correlation between the proportion of Serbians and poverty level among single females in the United States with a correlation coefficient (R) of 0.019 and weighted average of 20.1%. Similarly, the statistical analysis conducted on geographies consisting of 167,592,415 people shows a mild positive correlation between the proportion of Celtics and poverty level among single females in the United States with a correlation coefficient (R) of 0.360 and weighted average of 22.7%, a difference of 12.8%.
Single Female Poverty Correlation Summary
| Measurement | Serbian | Celtic |
| Minimum | 5.0% | 11.1% |
| Maximum | 56.7% | 100.0% |
| Range | 51.7% | 88.9% |
| Mean | 21.7% | 33.1% |
| Median | 20.7% | 27.8% |
| Interquartile 25% (IQ1) | 17.8% | 22.5% |
| Interquartile 75% (IQ3) | 27.4% | 39.6% |
| Interquartile Range (IQR) | 9.6% | 17.1% |
| Standard Deviation (Sample) | 11.2% | 16.9% |
| Standard Deviation (Population) | 11.1% | 16.7% |
Similar Demographics by Single Female Poverty
Demographics Similar to Serbians by Single Female Poverty
In terms of single female poverty, the demographic groups most similar to Serbians are Mongolian (20.2%, a difference of 0.020%), Immigrants from Spain (20.2%, a difference of 0.13%), Immigrants from South Africa (20.1%, a difference of 0.17%), Immigrants from Morocco (20.2%, a difference of 0.21%), and Immigrants from Hungary (20.2%, a difference of 0.23%).
| Demographics | Rating | Rank | Single Female Poverty |
| Immigrants | Ethiopia | 95.4 /100 | #119 | Exceptional 20.0% |
| South Americans | 95.1 /100 | #120 | Exceptional 20.0% |
| Immigrants | Switzerland | 95.1 /100 | #121 | Exceptional 20.0% |
| Immigrants | South America | 95.0 /100 | #122 | Exceptional 20.0% |
| Brazilians | 94.4 /100 | #123 | Exceptional 20.1% |
| Immigrants | Chile | 94.3 /100 | #124 | Exceptional 20.1% |
| Immigrants | South Africa | 93.9 /100 | #125 | Exceptional 20.1% |
| Serbians | 93.3 /100 | #126 | Exceptional 20.1% |
| Mongolians | 93.2 /100 | #127 | Exceptional 20.2% |
| Immigrants | Spain | 92.7 /100 | #128 | Exceptional 20.2% |
| Immigrants | Morocco | 92.4 /100 | #129 | Exceptional 20.2% |
| Immigrants | Hungary | 92.3 /100 | #130 | Exceptional 20.2% |
| Pakistanis | 92.1 /100 | #131 | Exceptional 20.2% |
| Uruguayans | 92.1 /100 | #132 | Exceptional 20.2% |
| Immigrants | England | 91.9 /100 | #133 | Exceptional 20.2% |
Demographics Similar to Celtics by Single Female Poverty
In terms of single female poverty, the demographic groups most similar to Celtics are White/Caucasian (22.7%, a difference of 0.080%), Bahamian (22.7%, a difference of 0.21%), Immigrants from Cabo Verde (22.8%, a difference of 0.27%), Sudanese (22.6%, a difference of 0.41%), and British West Indian (22.8%, a difference of 0.52%).
| Demographics | Rating | Rank | Single Female Poverty |
| Immigrants | Liberia | 0.9 /100 | #253 | Tragic 22.5% |
| Immigrants | Burma/Myanmar | 0.8 /100 | #254 | Tragic 22.6% |
| Immigrants | Sudan | 0.8 /100 | #255 | Tragic 22.6% |
| Immigrants | Belize | 0.8 /100 | #256 | Tragic 22.6% |
| Sudanese | 0.7 /100 | #257 | Tragic 22.6% |
| Bahamians | 0.6 /100 | #258 | Tragic 22.7% |
| Whites/Caucasians | 0.6 /100 | #259 | Tragic 22.7% |
| Celtics | 0.5 /100 | #260 | Tragic 22.7% |
| Immigrants | Cabo Verde | 0.4 /100 | #261 | Tragic 22.8% |
| British West Indians | 0.4 /100 | #262 | Tragic 22.8% |
| Scotch-Irish | 0.3 /100 | #263 | Tragic 22.9% |
| Immigrants | Laos | 0.3 /100 | #264 | Tragic 22.9% |
| Central Americans | 0.2 /100 | #265 | Tragic 23.0% |
| Immigrants | Micronesia | 0.2 /100 | #266 | Tragic 23.0% |
| Senegalese | 0.2 /100 | #267 | Tragic 23.0% |