Serbian vs Barbadian Single Female Poverty
COMPARE
Serbian
Barbadian
Single Female Poverty
Single Female Poverty Comparison
Serbians
Barbadians
20.1%
SINGLE FEMALE POVERTY
93.3/ 100
METRIC RATING
126th/ 347
METRIC RANK
21.8%
SINGLE FEMALE POVERTY
7.2/ 100
METRIC RATING
224th/ 347
METRIC RANK
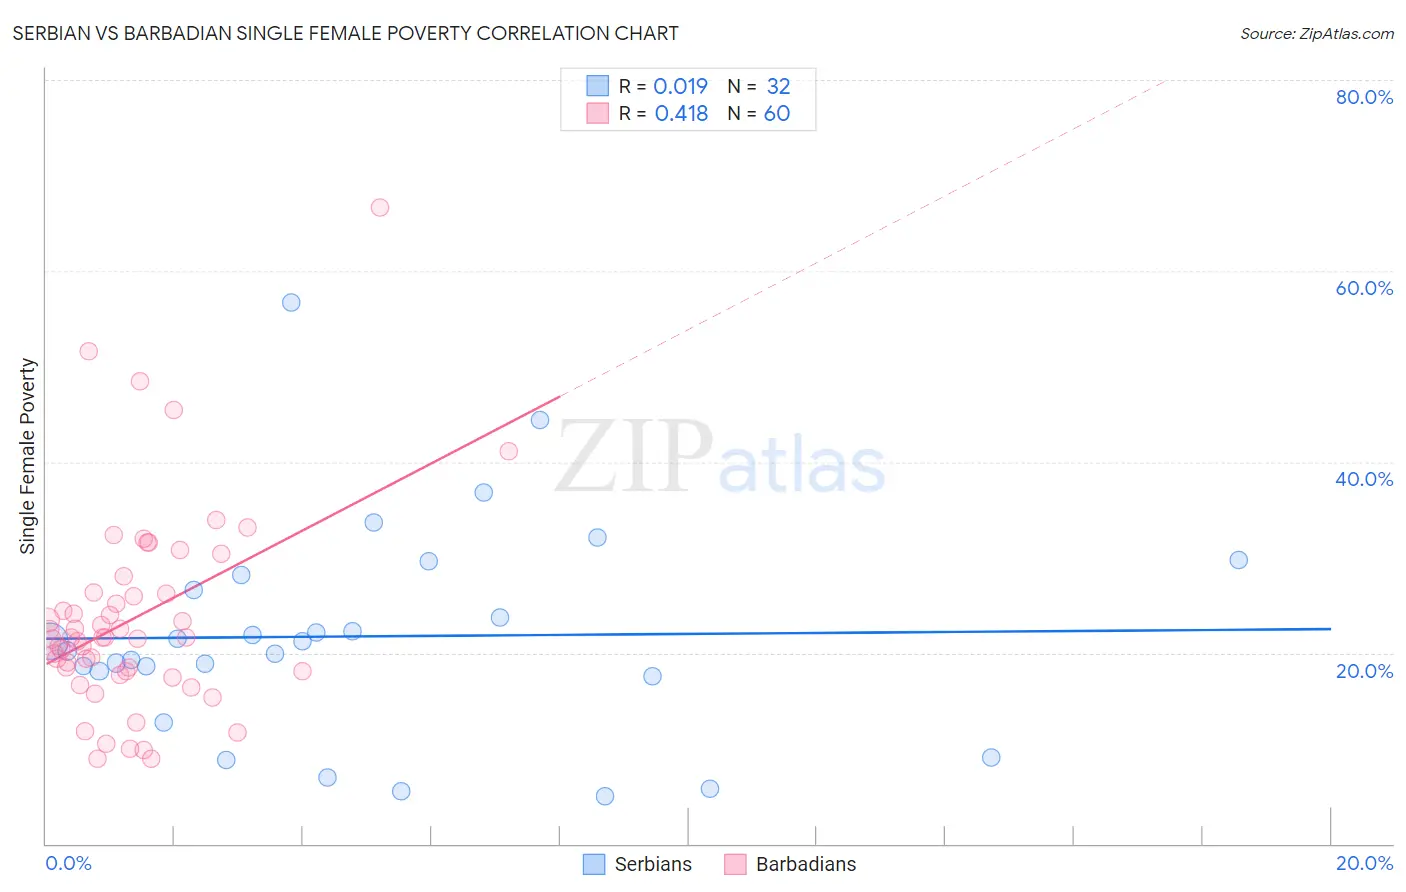
Serbian vs Barbadian Single Female Poverty Correlation Chart
The statistical analysis conducted on geographies consisting of 264,350,230 people shows no correlation between the proportion of Serbians and poverty level among single females in the United States with a correlation coefficient (R) of 0.019 and weighted average of 20.1%. Similarly, the statistical analysis conducted on geographies consisting of 140,678,915 people shows a moderate positive correlation between the proportion of Barbadians and poverty level among single females in the United States with a correlation coefficient (R) of 0.418 and weighted average of 21.8%, a difference of 8.4%.
Single Female Poverty Correlation Summary
| Measurement | Serbian | Barbadian |
| Minimum | 5.0% | 8.9% |
| Maximum | 56.7% | 66.7% |
| Range | 51.7% | 57.8% |
| Mean | 21.7% | 23.6% |
| Median | 20.7% | 21.6% |
| Interquartile 25% (IQ1) | 17.8% | 18.1% |
| Interquartile 75% (IQ3) | 27.4% | 26.3% |
| Interquartile Range (IQR) | 9.6% | 8.1% |
| Standard Deviation (Sample) | 11.2% | 10.6% |
| Standard Deviation (Population) | 11.1% | 10.5% |
Similar Demographics by Single Female Poverty
Demographics Similar to Serbians by Single Female Poverty
In terms of single female poverty, the demographic groups most similar to Serbians are Mongolian (20.2%, a difference of 0.020%), Immigrants from Spain (20.2%, a difference of 0.13%), Immigrants from South Africa (20.1%, a difference of 0.17%), Immigrants from Morocco (20.2%, a difference of 0.21%), and Immigrants from Hungary (20.2%, a difference of 0.23%).
| Demographics | Rating | Rank | Single Female Poverty |
| Immigrants | Ethiopia | 95.4 /100 | #119 | Exceptional 20.0% |
| South Americans | 95.1 /100 | #120 | Exceptional 20.0% |
| Immigrants | Switzerland | 95.1 /100 | #121 | Exceptional 20.0% |
| Immigrants | South America | 95.0 /100 | #122 | Exceptional 20.0% |
| Brazilians | 94.4 /100 | #123 | Exceptional 20.1% |
| Immigrants | Chile | 94.3 /100 | #124 | Exceptional 20.1% |
| Immigrants | South Africa | 93.9 /100 | #125 | Exceptional 20.1% |
| Serbians | 93.3 /100 | #126 | Exceptional 20.1% |
| Mongolians | 93.2 /100 | #127 | Exceptional 20.2% |
| Immigrants | Spain | 92.7 /100 | #128 | Exceptional 20.2% |
| Immigrants | Morocco | 92.4 /100 | #129 | Exceptional 20.2% |
| Immigrants | Hungary | 92.3 /100 | #130 | Exceptional 20.2% |
| Pakistanis | 92.1 /100 | #131 | Exceptional 20.2% |
| Uruguayans | 92.1 /100 | #132 | Exceptional 20.2% |
| Immigrants | England | 91.9 /100 | #133 | Exceptional 20.2% |
Demographics Similar to Barbadians by Single Female Poverty
In terms of single female poverty, the demographic groups most similar to Barbadians are Scottish (21.8%, a difference of 0.020%), Immigrants from Eritrea (21.8%, a difference of 0.16%), Immigrants from Grenada (21.8%, a difference of 0.17%), English (21.9%, a difference of 0.18%), and German (21.8%, a difference of 0.23%).
| Demographics | Rating | Rank | Single Female Poverty |
| Immigrants | St. Vincent and the Grenadines | 11.7 /100 | #217 | Poor 21.7% |
| Nepalese | 9.7 /100 | #218 | Tragic 21.7% |
| Panamanians | 9.4 /100 | #219 | Tragic 21.7% |
| Germans | 8.3 /100 | #220 | Tragic 21.8% |
| Immigrants | Grenada | 8.0 /100 | #221 | Tragic 21.8% |
| Immigrants | Eritrea | 7.9 /100 | #222 | Tragic 21.8% |
| Scottish | 7.3 /100 | #223 | Tragic 21.8% |
| Barbadians | 7.2 /100 | #224 | Tragic 21.8% |
| English | 6.4 /100 | #225 | Tragic 21.9% |
| Immigrants | Portugal | 5.8 /100 | #226 | Tragic 21.9% |
| Immigrants | Ghana | 5.8 /100 | #227 | Tragic 21.9% |
| Salvadorans | 5.5 /100 | #228 | Tragic 21.9% |
| Tlingit-Haida | 5.4 /100 | #229 | Tragic 21.9% |
| Immigrants | Western Africa | 5.3 /100 | #230 | Tragic 22.0% |
| Welsh | 5.0 /100 | #231 | Tragic 22.0% |