Serbian vs Immigrants from Cuba Single Female Poverty
COMPARE
Serbian
Immigrants from Cuba
Single Female Poverty
Single Female Poverty Comparison
Serbians
Immigrants from Cuba
20.1%
SINGLE FEMALE POVERTY
93.3/ 100
METRIC RATING
126th/ 347
METRIC RANK
21.2%
SINGLE FEMALE POVERTY
35.3/ 100
METRIC RATING
189th/ 347
METRIC RANK
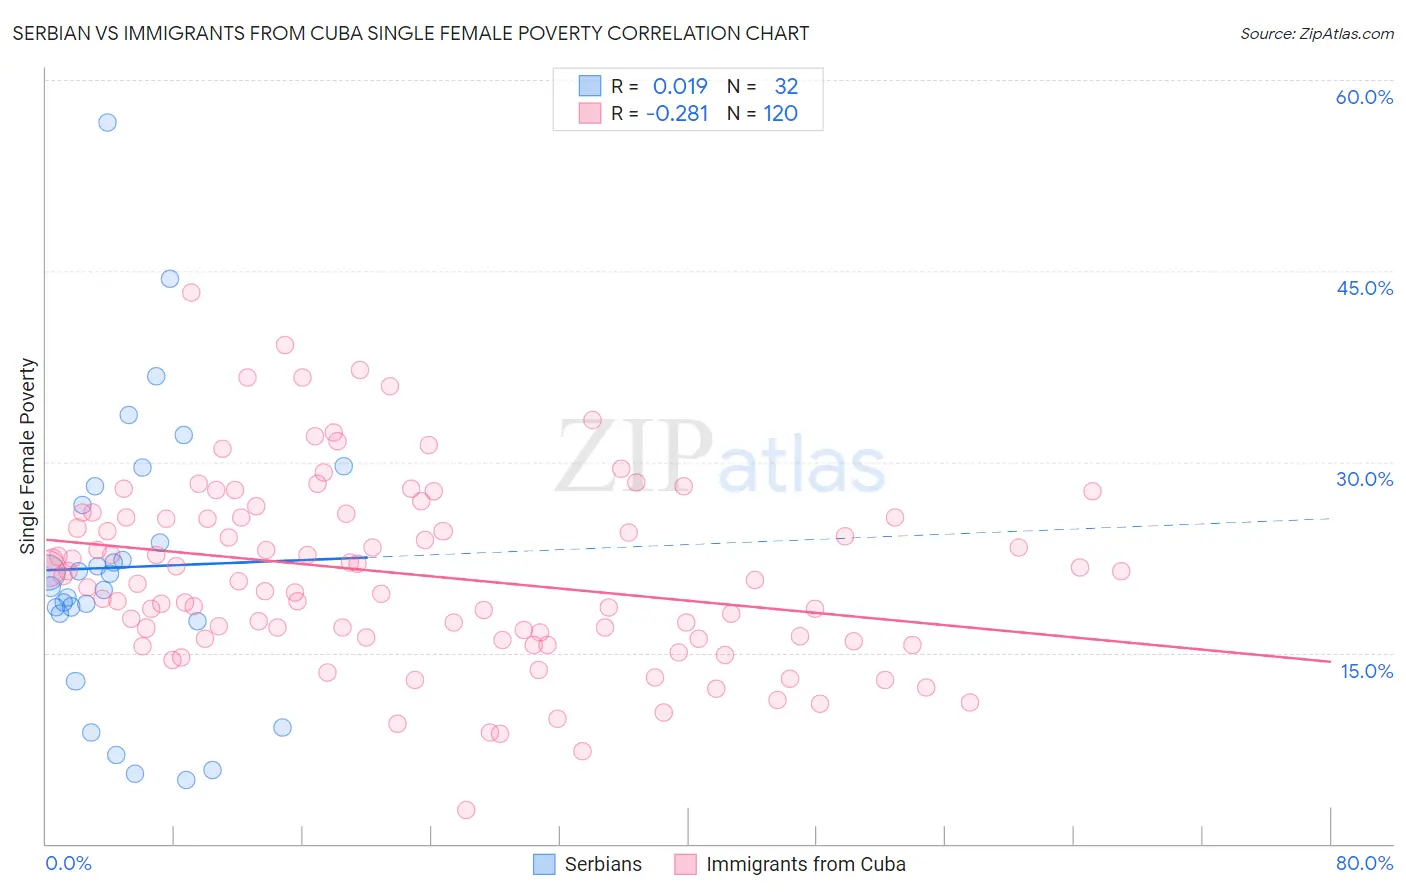
Serbian vs Immigrants from Cuba Single Female Poverty Correlation Chart
The statistical analysis conducted on geographies consisting of 264,350,230 people shows no correlation between the proportion of Serbians and poverty level among single females in the United States with a correlation coefficient (R) of 0.019 and weighted average of 20.1%. Similarly, the statistical analysis conducted on geographies consisting of 322,497,975 people shows a weak negative correlation between the proportion of Immigrants from Cuba and poverty level among single females in the United States with a correlation coefficient (R) of -0.281 and weighted average of 21.2%, a difference of 5.2%.
Single Female Poverty Correlation Summary
| Measurement | Serbian | Immigrants from Cuba |
| Minimum | 5.0% | 2.6% |
| Maximum | 56.7% | 43.3% |
| Range | 51.7% | 40.7% |
| Mean | 21.7% | 21.1% |
| Median | 20.7% | 20.7% |
| Interquartile 25% (IQ1) | 17.8% | 16.2% |
| Interquartile 75% (IQ3) | 27.4% | 25.7% |
| Interquartile Range (IQR) | 9.6% | 9.5% |
| Standard Deviation (Sample) | 11.2% | 7.2% |
| Standard Deviation (Population) | 11.1% | 7.2% |
Similar Demographics by Single Female Poverty
Demographics Similar to Serbians by Single Female Poverty
In terms of single female poverty, the demographic groups most similar to Serbians are Mongolian (20.2%, a difference of 0.020%), Immigrants from Spain (20.2%, a difference of 0.13%), Immigrants from South Africa (20.1%, a difference of 0.17%), Immigrants from Morocco (20.2%, a difference of 0.21%), and Immigrants from Hungary (20.2%, a difference of 0.23%).
| Demographics | Rating | Rank | Single Female Poverty |
| Immigrants | Ethiopia | 95.4 /100 | #119 | Exceptional 20.0% |
| South Americans | 95.1 /100 | #120 | Exceptional 20.0% |
| Immigrants | Switzerland | 95.1 /100 | #121 | Exceptional 20.0% |
| Immigrants | South America | 95.0 /100 | #122 | Exceptional 20.0% |
| Brazilians | 94.4 /100 | #123 | Exceptional 20.1% |
| Immigrants | Chile | 94.3 /100 | #124 | Exceptional 20.1% |
| Immigrants | South Africa | 93.9 /100 | #125 | Exceptional 20.1% |
| Serbians | 93.3 /100 | #126 | Exceptional 20.1% |
| Mongolians | 93.2 /100 | #127 | Exceptional 20.2% |
| Immigrants | Spain | 92.7 /100 | #128 | Exceptional 20.2% |
| Immigrants | Morocco | 92.4 /100 | #129 | Exceptional 20.2% |
| Immigrants | Hungary | 92.3 /100 | #130 | Exceptional 20.2% |
| Pakistanis | 92.1 /100 | #131 | Exceptional 20.2% |
| Uruguayans | 92.1 /100 | #132 | Exceptional 20.2% |
| Immigrants | England | 91.9 /100 | #133 | Exceptional 20.2% |
Demographics Similar to Immigrants from Cuba by Single Female Poverty
In terms of single female poverty, the demographic groups most similar to Immigrants from Cuba are Trinidadian and Tobagonian (21.2%, a difference of 0.0%), Yugoslavian (21.2%, a difference of 0.010%), Immigrants from Nigeria (21.2%, a difference of 0.10%), Hawaiian (21.2%, a difference of 0.16%), and Immigrants from Cambodia (21.2%, a difference of 0.20%).
| Demographics | Rating | Rank | Single Female Poverty |
| Slavs | 40.5 /100 | #182 | Average 21.1% |
| Slovaks | 39.7 /100 | #183 | Fair 21.1% |
| Hungarians | 39.6 /100 | #184 | Fair 21.1% |
| Immigrants | Cambodia | 38.2 /100 | #185 | Fair 21.2% |
| Hawaiians | 37.7 /100 | #186 | Fair 21.2% |
| Immigrants | Nigeria | 36.8 /100 | #187 | Fair 21.2% |
| Yugoslavians | 35.4 /100 | #188 | Fair 21.2% |
| Immigrants | Cuba | 35.3 /100 | #189 | Fair 21.2% |
| Trinidadians and Tobagonians | 35.2 /100 | #190 | Fair 21.2% |
| Immigrants | Germany | 31.1 /100 | #191 | Fair 21.3% |
| Immigrants | Jamaica | 30.5 /100 | #192 | Fair 21.3% |
| Basques | 28.1 /100 | #193 | Fair 21.3% |
| Czechoslovakians | 27.7 /100 | #194 | Fair 21.3% |
| Nicaraguans | 27.6 /100 | #195 | Fair 21.3% |
| Immigrants | Saudi Arabia | 27.1 /100 | #196 | Fair 21.3% |