Serbian vs Immigrants from Zaire Single Female Poverty
COMPARE
Serbian
Immigrants from Zaire
Single Female Poverty
Single Female Poverty Comparison
Serbians
Immigrants from Zaire
20.1%
SINGLE FEMALE POVERTY
93.3/ 100
METRIC RATING
126th/ 347
METRIC RANK
23.8%
SINGLE FEMALE POVERTY
0.0/ 100
METRIC RATING
281st/ 347
METRIC RANK
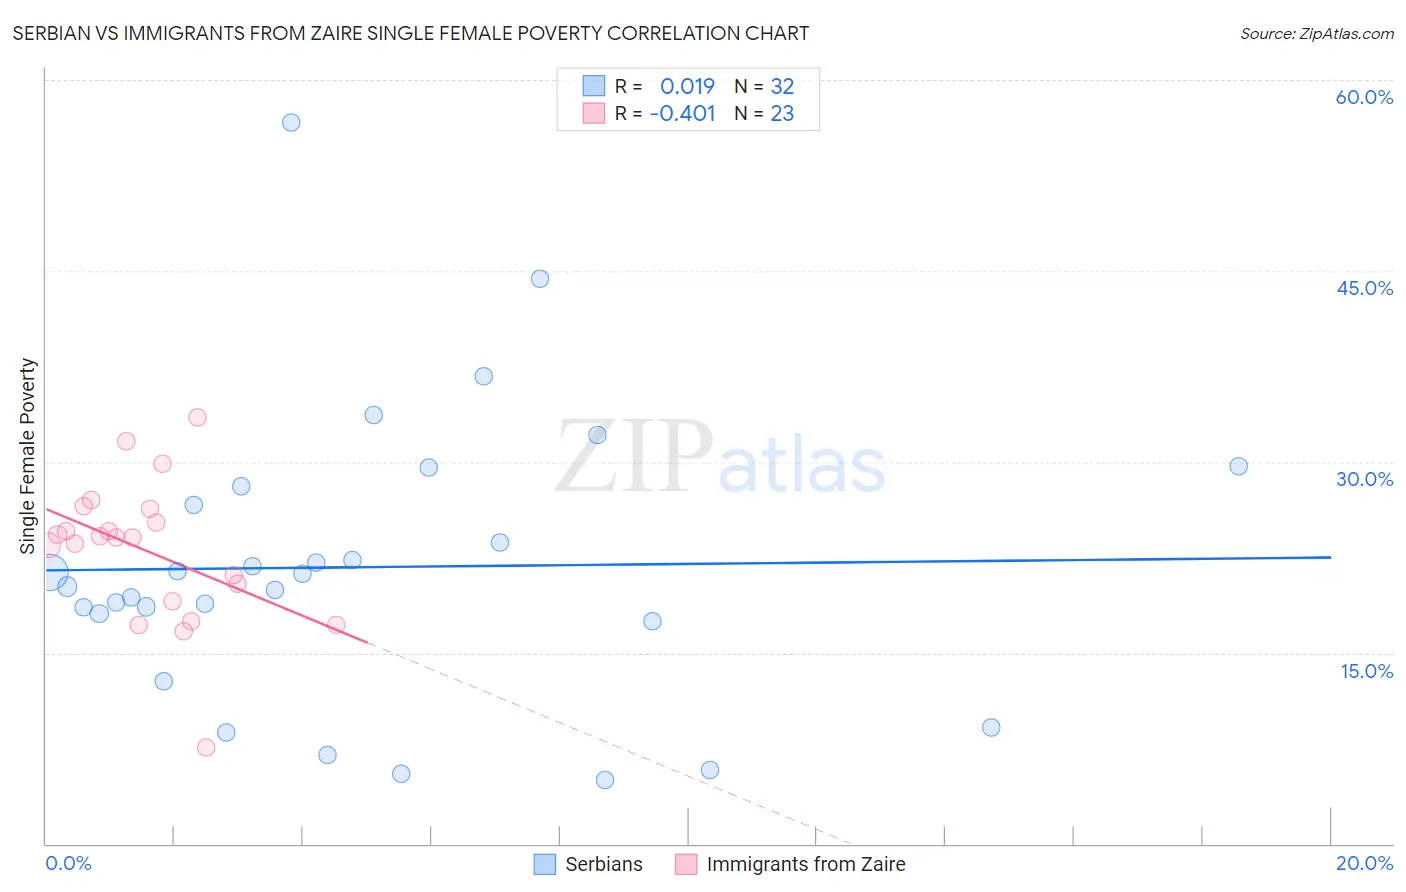
Serbian vs Immigrants from Zaire Single Female Poverty Correlation Chart
The statistical analysis conducted on geographies consisting of 264,350,230 people shows no correlation between the proportion of Serbians and poverty level among single females in the United States with a correlation coefficient (R) of 0.019 and weighted average of 20.1%. Similarly, the statistical analysis conducted on geographies consisting of 106,941,709 people shows a moderate negative correlation between the proportion of Immigrants from Zaire and poverty level among single females in the United States with a correlation coefficient (R) of -0.401 and weighted average of 23.8%, a difference of 18.3%.
Single Female Poverty Correlation Summary
| Measurement | Serbian | Immigrants from Zaire |
| Minimum | 5.0% | 7.5% |
| Maximum | 56.7% | 33.4% |
| Range | 51.7% | 25.9% |
| Mean | 21.7% | 23.0% |
| Median | 20.7% | 24.0% |
| Interquartile 25% (IQ1) | 17.8% | 19.0% |
| Interquartile 75% (IQ3) | 27.4% | 26.3% |
| Interquartile Range (IQR) | 9.6% | 7.3% |
| Standard Deviation (Sample) | 11.2% | 5.6% |
| Standard Deviation (Population) | 11.1% | 5.5% |
Similar Demographics by Single Female Poverty
Demographics Similar to Serbians by Single Female Poverty
In terms of single female poverty, the demographic groups most similar to Serbians are Mongolian (20.2%, a difference of 0.020%), Immigrants from Spain (20.2%, a difference of 0.13%), Immigrants from South Africa (20.1%, a difference of 0.17%), Immigrants from Morocco (20.2%, a difference of 0.21%), and Immigrants from Hungary (20.2%, a difference of 0.23%).
| Demographics | Rating | Rank | Single Female Poverty |
| Immigrants | Ethiopia | 95.4 /100 | #119 | Exceptional 20.0% |
| South Americans | 95.1 /100 | #120 | Exceptional 20.0% |
| Immigrants | Switzerland | 95.1 /100 | #121 | Exceptional 20.0% |
| Immigrants | South America | 95.0 /100 | #122 | Exceptional 20.0% |
| Brazilians | 94.4 /100 | #123 | Exceptional 20.1% |
| Immigrants | Chile | 94.3 /100 | #124 | Exceptional 20.1% |
| Immigrants | South Africa | 93.9 /100 | #125 | Exceptional 20.1% |
| Serbians | 93.3 /100 | #126 | Exceptional 20.1% |
| Mongolians | 93.2 /100 | #127 | Exceptional 20.2% |
| Immigrants | Spain | 92.7 /100 | #128 | Exceptional 20.2% |
| Immigrants | Morocco | 92.4 /100 | #129 | Exceptional 20.2% |
| Immigrants | Hungary | 92.3 /100 | #130 | Exceptional 20.2% |
| Pakistanis | 92.1 /100 | #131 | Exceptional 20.2% |
| Uruguayans | 92.1 /100 | #132 | Exceptional 20.2% |
| Immigrants | England | 91.9 /100 | #133 | Exceptional 20.2% |
Demographics Similar to Immigrants from Zaire by Single Female Poverty
In terms of single female poverty, the demographic groups most similar to Immigrants from Zaire are Guatemalan (23.8%, a difference of 0.050%), German Russian (23.9%, a difference of 0.20%), Immigrants from Dominica (23.9%, a difference of 0.31%), Immigrants from Latin America (23.7%, a difference of 0.51%), and Alaskan Athabascan (23.6%, a difference of 1.0%).
| Demographics | Rating | Rank | Single Female Poverty |
| Marshallese | 0.1 /100 | #274 | Tragic 23.3% |
| Mexican American Indians | 0.1 /100 | #275 | Tragic 23.4% |
| Immigrants | Azores | 0.0 /100 | #276 | Tragic 23.5% |
| Pennsylvania Germans | 0.0 /100 | #277 | Tragic 23.6% |
| Immigrants | Nonimmigrants | 0.0 /100 | #278 | Tragic 23.6% |
| Alaskan Athabascans | 0.0 /100 | #279 | Tragic 23.6% |
| Immigrants | Latin America | 0.0 /100 | #280 | Tragic 23.7% |
| Immigrants | Zaire | 0.0 /100 | #281 | Tragic 23.8% |
| Guatemalans | 0.0 /100 | #282 | Tragic 23.8% |
| German Russians | 0.0 /100 | #283 | Tragic 23.9% |
| Immigrants | Dominica | 0.0 /100 | #284 | Tragic 23.9% |
| Immigrants | Guatemala | 0.0 /100 | #285 | Tragic 24.1% |
| Cree | 0.0 /100 | #286 | Tragic 24.1% |
| Bangladeshis | 0.0 /100 | #287 | Tragic 24.2% |
| Spanish Americans | 0.0 /100 | #288 | Tragic 24.2% |