Scotch-Irish vs Crow Poverty
COMPARE
Scotch-Irish
Crow
Poverty
Poverty Comparison
Scotch-Irish
Crow
12.2%
POVERTY
62.6/ 100
METRIC RATING
156th/ 347
METRIC RANK
20.7%
POVERTY
0.0/ 100
METRIC RATING
339th/ 347
METRIC RANK
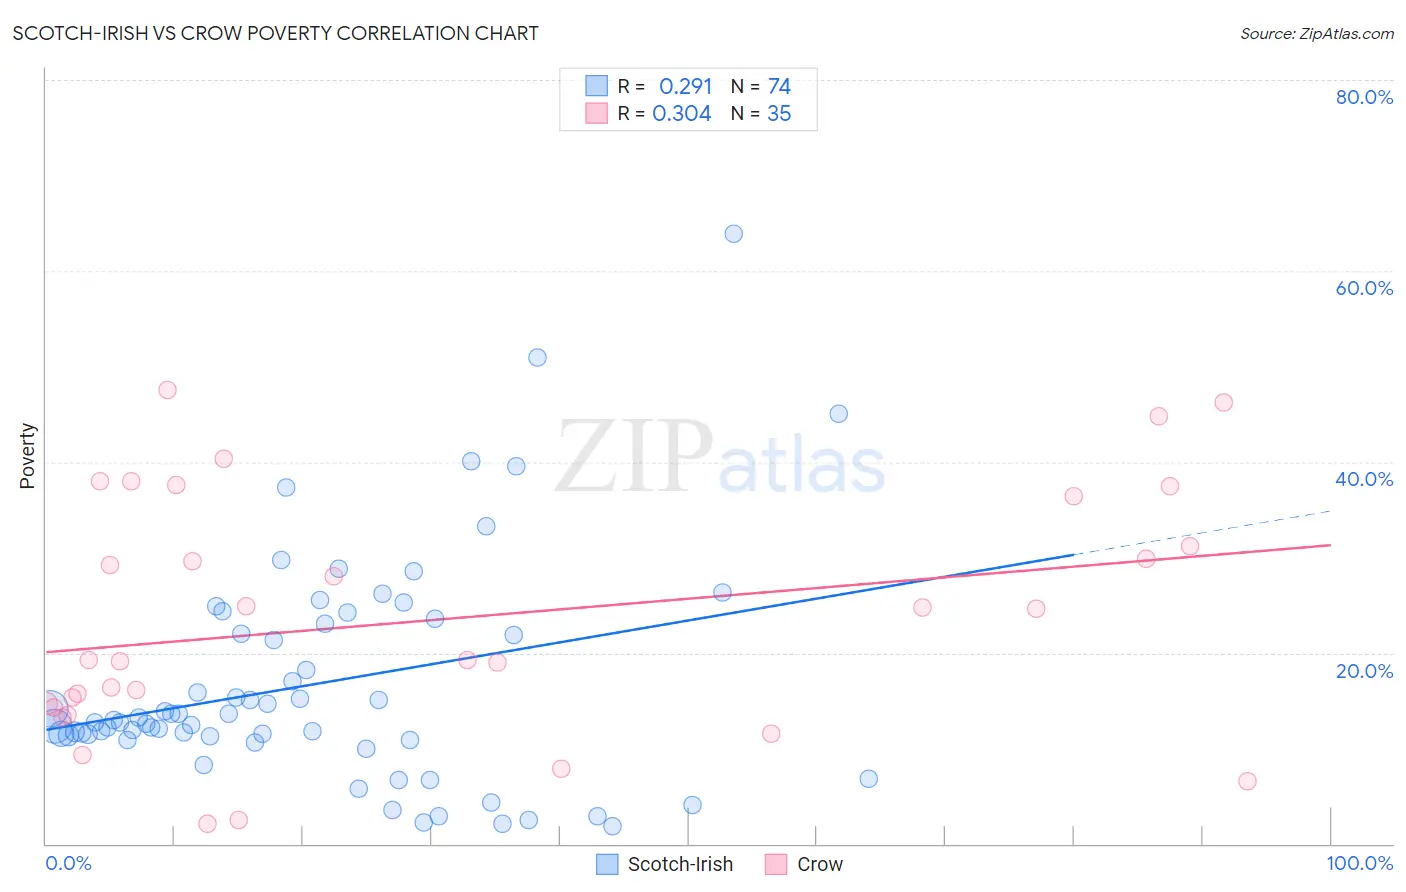
Scotch-Irish vs Crow Poverty Correlation Chart
The statistical analysis conducted on geographies consisting of 548,217,294 people shows a weak positive correlation between the proportion of Scotch-Irish and poverty level in the United States with a correlation coefficient (R) of 0.291 and weighted average of 12.2%. Similarly, the statistical analysis conducted on geographies consisting of 59,200,262 people shows a mild positive correlation between the proportion of Crow and poverty level in the United States with a correlation coefficient (R) of 0.304 and weighted average of 20.7%, a difference of 69.8%.
Poverty Correlation Summary
| Measurement | Scotch-Irish | Crow |
| Minimum | 1.8% | 2.1% |
| Maximum | 63.9% | 47.5% |
| Range | 62.1% | 45.4% |
| Mean | 16.7% | 23.5% |
| Median | 12.9% | 19.2% |
| Interquartile 25% (IQ1) | 11.3% | 14.3% |
| Interquartile 75% (IQ3) | 23.0% | 36.4% |
| Interquartile Range (IQR) | 11.7% | 22.1% |
| Standard Deviation (Sample) | 11.7% | 12.7% |
| Standard Deviation (Population) | 11.6% | 12.5% |
Similar Demographics by Poverty
Demographics Similar to Scotch-Irish by Poverty
In terms of poverty, the demographic groups most similar to Scotch-Irish are Costa Rican (12.2%, a difference of 0.040%), Taiwanese (12.2%, a difference of 0.080%), Hungarian (12.2%, a difference of 0.11%), Guamanian/Chamorro (12.1%, a difference of 0.14%), and Immigrants from Northern Africa (12.1%, a difference of 0.15%).
| Demographics | Rating | Rank | Poverty |
| Immigrants | Malaysia | 72.7 /100 | #149 | Good 12.0% |
| Immigrants | Kazakhstan | 72.3 /100 | #150 | Good 12.0% |
| Samoans | 71.9 /100 | #151 | Good 12.0% |
| Armenians | 67.6 /100 | #152 | Good 12.1% |
| Immigrants | Northern Africa | 63.9 /100 | #153 | Good 12.1% |
| Guamanians/Chamorros | 63.9 /100 | #154 | Good 12.1% |
| Hungarians | 63.6 /100 | #155 | Good 12.2% |
| Scotch-Irish | 62.6 /100 | #156 | Good 12.2% |
| Costa Ricans | 62.2 /100 | #157 | Good 12.2% |
| Taiwanese | 61.8 /100 | #158 | Good 12.2% |
| Pennsylvania Germans | 60.8 /100 | #159 | Good 12.2% |
| Immigrants | Nepal | 60.4 /100 | #160 | Good 12.2% |
| Immigrants | Fiji | 59.1 /100 | #161 | Average 12.2% |
| Ethiopians | 59.1 /100 | #162 | Average 12.2% |
| Immigrants | Ethiopia | 58.6 /100 | #163 | Average 12.2% |
Demographics Similar to Crow by Poverty
In terms of poverty, the demographic groups most similar to Crow are Yup'ik (20.8%, a difference of 0.75%), Hopi (20.8%, a difference of 0.93%), Yuman (20.2%, a difference of 2.2%), Immigrants from Yemen (21.5%, a difference of 4.1%), and Sioux (19.8%, a difference of 4.5%).
| Demographics | Rating | Rank | Poverty |
| Natives/Alaskans | 0.0 /100 | #332 | Tragic 18.1% |
| Houma | 0.0 /100 | #333 | Tragic 18.4% |
| Apache | 0.0 /100 | #334 | Tragic 18.4% |
| Cheyenne | 0.0 /100 | #335 | Tragic 18.9% |
| Pueblo | 0.0 /100 | #336 | Tragic 19.4% |
| Sioux | 0.0 /100 | #337 | Tragic 19.8% |
| Yuman | 0.0 /100 | #338 | Tragic 20.2% |
| Crow | 0.0 /100 | #339 | Tragic 20.7% |
| Yup'ik | 0.0 /100 | #340 | Tragic 20.8% |
| Hopi | 0.0 /100 | #341 | Tragic 20.8% |
| Immigrants | Yemen | 0.0 /100 | #342 | Tragic 21.5% |
| Pima | 0.0 /100 | #343 | Tragic 21.9% |
| Lumbee | 0.0 /100 | #344 | Tragic 21.9% |
| Navajo | 0.0 /100 | #345 | Tragic 23.1% |
| Puerto Ricans | 0.0 /100 | #346 | Tragic 23.7% |