Scotch-Irish vs Tlingit-Haida Poverty
COMPARE
Scotch-Irish
Tlingit-Haida
Poverty
Poverty Comparison
Scotch-Irish
Tlingit-Haida
12.2%
POVERTY
62.6/ 100
METRIC RATING
156th/ 347
METRIC RANK
11.7%
POVERTY
89.0/ 100
METRIC RATING
119th/ 347
METRIC RANK
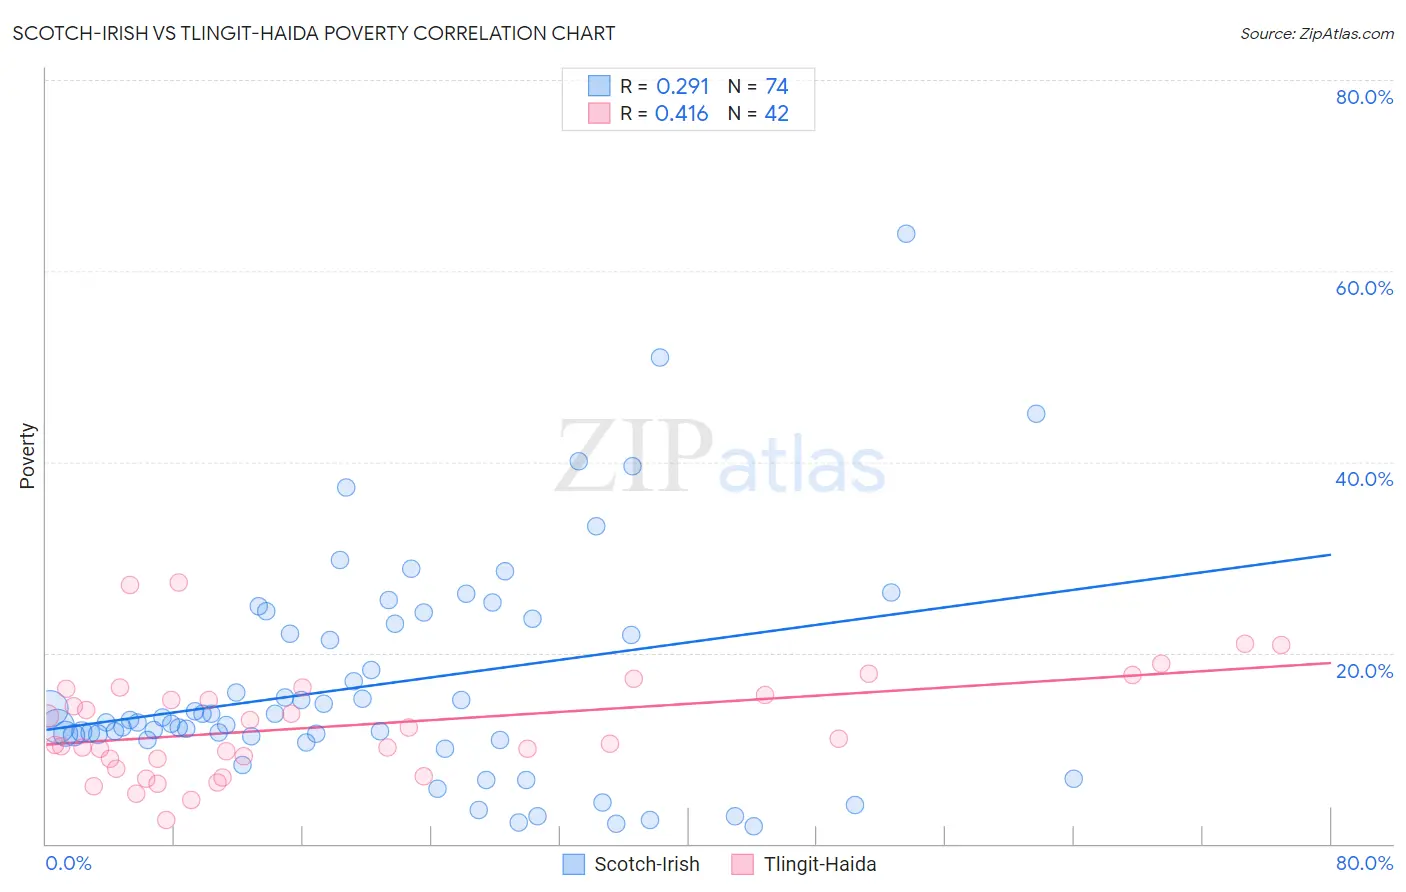
Scotch-Irish vs Tlingit-Haida Poverty Correlation Chart
The statistical analysis conducted on geographies consisting of 548,217,294 people shows a weak positive correlation between the proportion of Scotch-Irish and poverty level in the United States with a correlation coefficient (R) of 0.291 and weighted average of 12.2%. Similarly, the statistical analysis conducted on geographies consisting of 60,855,126 people shows a moderate positive correlation between the proportion of Tlingit-Haida and poverty level in the United States with a correlation coefficient (R) of 0.416 and weighted average of 11.7%, a difference of 4.0%.
Poverty Correlation Summary
| Measurement | Scotch-Irish | Tlingit-Haida |
| Minimum | 1.8% | 2.5% |
| Maximum | 63.9% | 27.4% |
| Range | 62.1% | 24.9% |
| Mean | 16.7% | 12.4% |
| Median | 12.9% | 10.8% |
| Interquartile 25% (IQ1) | 11.3% | 8.9% |
| Interquartile 75% (IQ3) | 23.0% | 16.2% |
| Interquartile Range (IQR) | 11.7% | 7.3% |
| Standard Deviation (Sample) | 11.7% | 5.6% |
| Standard Deviation (Population) | 11.6% | 5.6% |
Similar Demographics by Poverty
Demographics Similar to Scotch-Irish by Poverty
In terms of poverty, the demographic groups most similar to Scotch-Irish are Costa Rican (12.2%, a difference of 0.040%), Taiwanese (12.2%, a difference of 0.080%), Hungarian (12.2%, a difference of 0.11%), Guamanian/Chamorro (12.1%, a difference of 0.14%), and Immigrants from Northern Africa (12.1%, a difference of 0.15%).
| Demographics | Rating | Rank | Poverty |
| Immigrants | Malaysia | 72.7 /100 | #149 | Good 12.0% |
| Immigrants | Kazakhstan | 72.3 /100 | #150 | Good 12.0% |
| Samoans | 71.9 /100 | #151 | Good 12.0% |
| Armenians | 67.6 /100 | #152 | Good 12.1% |
| Immigrants | Northern Africa | 63.9 /100 | #153 | Good 12.1% |
| Guamanians/Chamorros | 63.9 /100 | #154 | Good 12.1% |
| Hungarians | 63.6 /100 | #155 | Good 12.2% |
| Scotch-Irish | 62.6 /100 | #156 | Good 12.2% |
| Costa Ricans | 62.2 /100 | #157 | Good 12.2% |
| Taiwanese | 61.8 /100 | #158 | Good 12.2% |
| Pennsylvania Germans | 60.8 /100 | #159 | Good 12.2% |
| Immigrants | Nepal | 60.4 /100 | #160 | Good 12.2% |
| Immigrants | Fiji | 59.1 /100 | #161 | Average 12.2% |
| Ethiopians | 59.1 /100 | #162 | Average 12.2% |
| Immigrants | Ethiopia | 58.6 /100 | #163 | Average 12.2% |
Demographics Similar to Tlingit-Haida by Poverty
In terms of poverty, the demographic groups most similar to Tlingit-Haida are Immigrants from South Eastern Asia (11.7%, a difference of 0.010%), Argentinean (11.7%, a difference of 0.040%), New Zealander (11.7%, a difference of 0.070%), Puget Sound Salish (11.7%, a difference of 0.070%), and Immigrants from Hungary (11.7%, a difference of 0.090%).
| Demographics | Rating | Rank | Poverty |
| Immigrants | Southern Europe | 90.8 /100 | #112 | Exceptional 11.6% |
| Immigrants | Belarus | 90.8 /100 | #113 | Exceptional 11.6% |
| Immigrants | China | 90.7 /100 | #114 | Exceptional 11.6% |
| Albanians | 90.3 /100 | #115 | Exceptional 11.7% |
| Immigrants | Russia | 89.7 /100 | #116 | Excellent 11.7% |
| Sri Lankans | 89.4 /100 | #117 | Excellent 11.7% |
| Argentineans | 89.1 /100 | #118 | Excellent 11.7% |
| Tlingit-Haida | 89.0 /100 | #119 | Excellent 11.7% |
| Immigrants | South Eastern Asia | 88.9 /100 | #120 | Excellent 11.7% |
| New Zealanders | 88.7 /100 | #121 | Excellent 11.7% |
| Puget Sound Salish | 88.7 /100 | #122 | Excellent 11.7% |
| Immigrants | Hungary | 88.6 /100 | #123 | Excellent 11.7% |
| Soviet Union | 88.4 /100 | #124 | Excellent 11.7% |
| Immigrants | Brazil | 88.2 /100 | #125 | Excellent 11.7% |
| Immigrants | Norway | 88.0 /100 | #126 | Excellent 11.7% |