Scotch-Irish vs Arab Poverty
COMPARE
Scotch-Irish
Arab
Poverty
Poverty Comparison
Scotch-Irish
Arabs
12.2%
POVERTY
62.6/ 100
METRIC RATING
156th/ 347
METRIC RANK
12.7%
POVERTY
21.1/ 100
METRIC RATING
194th/ 347
METRIC RANK
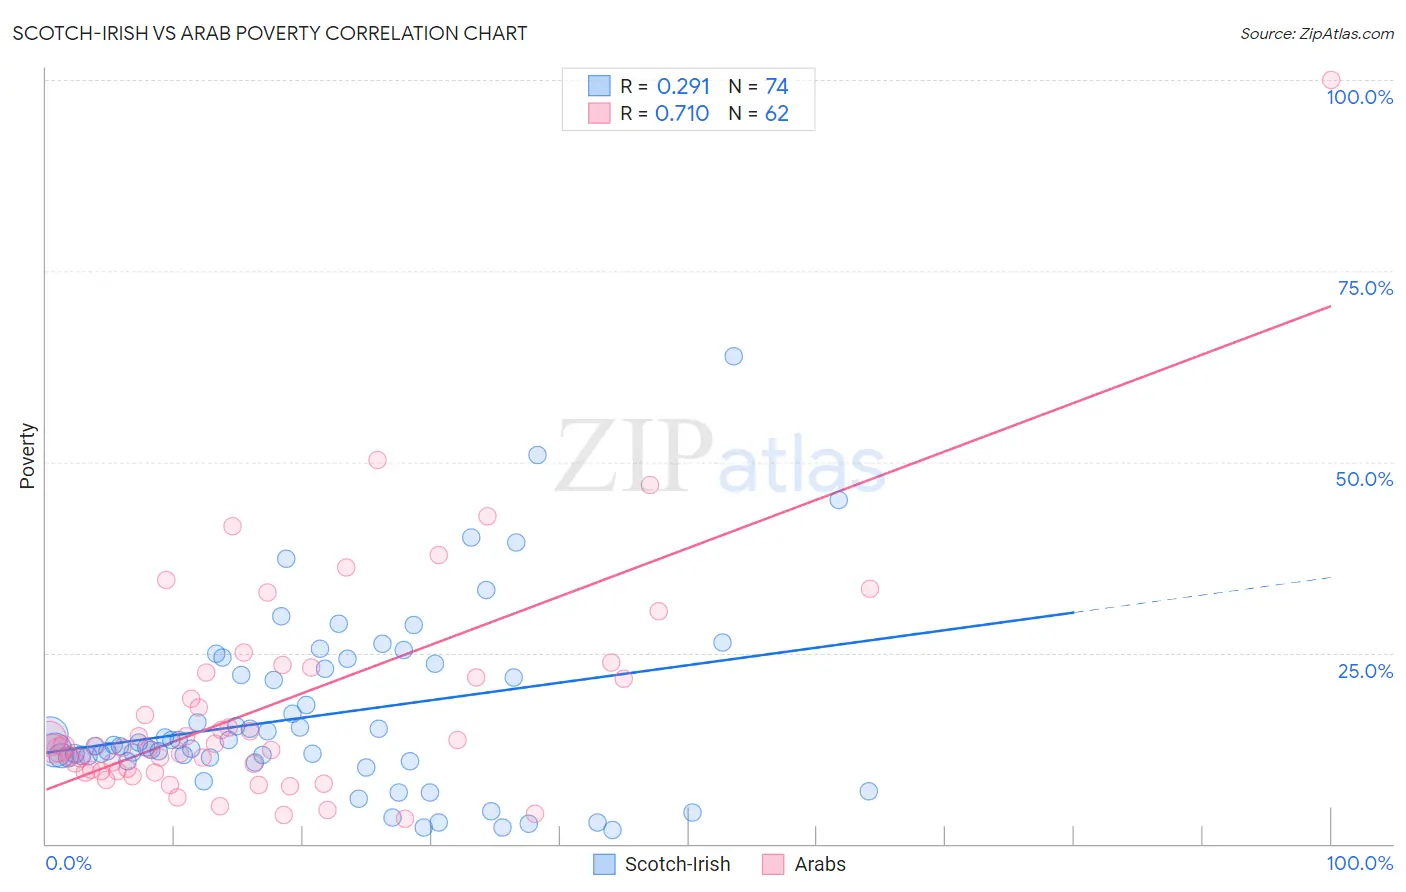
Scotch-Irish vs Arab Poverty Correlation Chart
The statistical analysis conducted on geographies consisting of 548,217,294 people shows a weak positive correlation between the proportion of Scotch-Irish and poverty level in the United States with a correlation coefficient (R) of 0.291 and weighted average of 12.2%. Similarly, the statistical analysis conducted on geographies consisting of 486,388,677 people shows a strong positive correlation between the proportion of Arabs and poverty level in the United States with a correlation coefficient (R) of 0.710 and weighted average of 12.7%, a difference of 4.5%.
Poverty Correlation Summary
| Measurement | Scotch-Irish | Arab |
| Minimum | 1.8% | 3.3% |
| Maximum | 63.9% | 100.0% |
| Range | 62.1% | 96.7% |
| Mean | 16.7% | 18.1% |
| Median | 12.9% | 12.7% |
| Interquartile 25% (IQ1) | 11.3% | 9.5% |
| Interquartile 75% (IQ3) | 23.0% | 22.3% |
| Interquartile Range (IQR) | 11.7% | 12.9% |
| Standard Deviation (Sample) | 11.7% | 15.4% |
| Standard Deviation (Population) | 11.6% | 15.3% |
Similar Demographics by Poverty
Demographics Similar to Scotch-Irish by Poverty
In terms of poverty, the demographic groups most similar to Scotch-Irish are Costa Rican (12.2%, a difference of 0.040%), Taiwanese (12.2%, a difference of 0.080%), Hungarian (12.2%, a difference of 0.11%), Guamanian/Chamorro (12.1%, a difference of 0.14%), and Immigrants from Northern Africa (12.1%, a difference of 0.15%).
| Demographics | Rating | Rank | Poverty |
| Immigrants | Malaysia | 72.7 /100 | #149 | Good 12.0% |
| Immigrants | Kazakhstan | 72.3 /100 | #150 | Good 12.0% |
| Samoans | 71.9 /100 | #151 | Good 12.0% |
| Armenians | 67.6 /100 | #152 | Good 12.1% |
| Immigrants | Northern Africa | 63.9 /100 | #153 | Good 12.1% |
| Guamanians/Chamorros | 63.9 /100 | #154 | Good 12.1% |
| Hungarians | 63.6 /100 | #155 | Good 12.2% |
| Scotch-Irish | 62.6 /100 | #156 | Good 12.2% |
| Costa Ricans | 62.2 /100 | #157 | Good 12.2% |
| Taiwanese | 61.8 /100 | #158 | Good 12.2% |
| Pennsylvania Germans | 60.8 /100 | #159 | Good 12.2% |
| Immigrants | Nepal | 60.4 /100 | #160 | Good 12.2% |
| Immigrants | Fiji | 59.1 /100 | #161 | Average 12.2% |
| Ethiopians | 59.1 /100 | #162 | Average 12.2% |
| Immigrants | Ethiopia | 58.6 /100 | #163 | Average 12.2% |
Demographics Similar to Arabs by Poverty
In terms of poverty, the demographic groups most similar to Arabs are Immigrants from Kuwait (12.7%, a difference of 0.030%), Delaware (12.7%, a difference of 0.040%), Iraqi (12.7%, a difference of 0.050%), South American Indian (12.7%, a difference of 0.29%), and Immigrants from Lebanon (12.8%, a difference of 0.36%).
| Demographics | Rating | Rank | Poverty |
| Hawaiians | 34.1 /100 | #187 | Fair 12.5% |
| Immigrants | Costa Rica | 33.3 /100 | #188 | Fair 12.5% |
| Aleuts | 33.2 /100 | #189 | Fair 12.5% |
| Immigrants | South America | 32.3 /100 | #190 | Fair 12.5% |
| Sierra Leoneans | 31.5 /100 | #191 | Fair 12.6% |
| South American Indians | 23.3 /100 | #192 | Fair 12.7% |
| Delaware | 21.4 /100 | #193 | Fair 12.7% |
| Arabs | 21.1 /100 | #194 | Fair 12.7% |
| Immigrants | Kuwait | 20.9 /100 | #195 | Fair 12.7% |
| Iraqis | 20.8 /100 | #196 | Fair 12.7% |
| Immigrants | Lebanon | 18.7 /100 | #197 | Poor 12.8% |
| Spanish | 18.7 /100 | #198 | Poor 12.8% |
| Immigrants | Kenya | 17.5 /100 | #199 | Poor 12.8% |
| Spaniards | 16.5 /100 | #200 | Poor 12.8% |
| Immigrants | Uganda | 16.5 /100 | #201 | Poor 12.8% |