Immigrants from Iran vs Crow Poverty
COMPARE
Immigrants from Iran
Crow
Poverty
Poverty Comparison
Immigrants from Iran
Crow
10.9%
POVERTY
99.2/ 100
METRIC RATING
41st/ 347
METRIC RANK
20.7%
POVERTY
0.0/ 100
METRIC RATING
339th/ 347
METRIC RANK
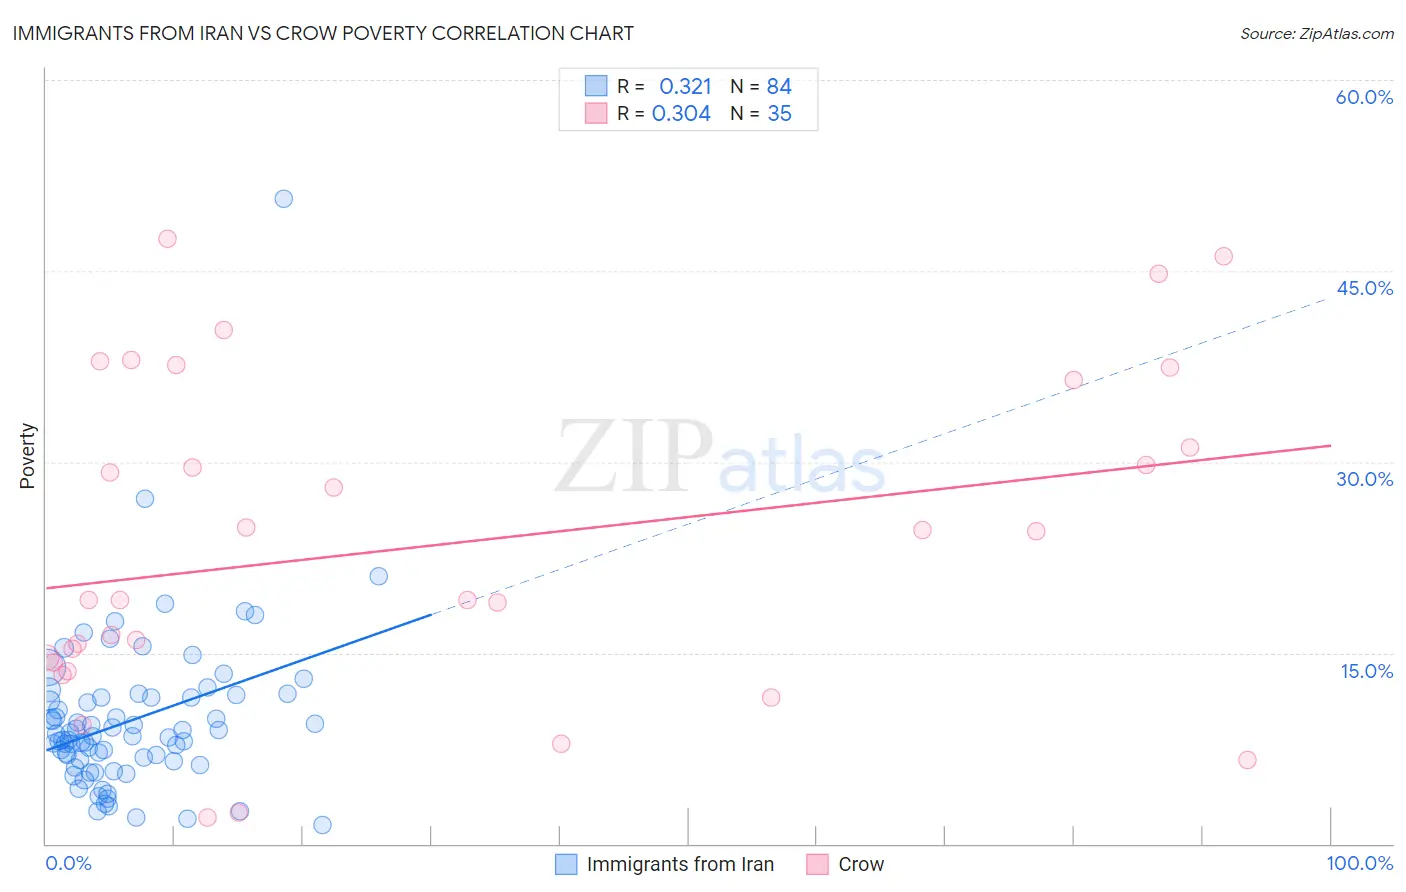
Immigrants from Iran vs Crow Poverty Correlation Chart
The statistical analysis conducted on geographies consisting of 279,844,732 people shows a mild positive correlation between the proportion of Immigrants from Iran and poverty level in the United States with a correlation coefficient (R) of 0.321 and weighted average of 10.9%. Similarly, the statistical analysis conducted on geographies consisting of 59,200,262 people shows a mild positive correlation between the proportion of Crow and poverty level in the United States with a correlation coefficient (R) of 0.304 and weighted average of 20.7%, a difference of 90.2%.
Poverty Correlation Summary
| Measurement | Immigrants from Iran | Crow |
| Minimum | 1.5% | 2.1% |
| Maximum | 50.6% | 47.5% |
| Range | 49.1% | 45.4% |
| Mean | 9.7% | 23.5% |
| Median | 8.4% | 19.2% |
| Interquartile 25% (IQ1) | 6.5% | 14.3% |
| Interquartile 75% (IQ3) | 11.5% | 36.4% |
| Interquartile Range (IQR) | 5.0% | 22.1% |
| Standard Deviation (Sample) | 6.4% | 12.7% |
| Standard Deviation (Population) | 6.4% | 12.5% |
Similar Demographics by Poverty
Demographics Similar to Immigrants from Iran by Poverty
In terms of poverty, the demographic groups most similar to Immigrants from Iran are Russian (10.9%, a difference of 0.090%), Immigrants from Pakistan (10.8%, a difference of 0.14%), Czech (10.8%, a difference of 0.22%), Korean (10.9%, a difference of 0.22%), and Immigrants from Greece (10.8%, a difference of 0.26%).
| Demographics | Rating | Rank | Poverty |
| Immigrants | Poland | 99.4 /100 | #34 | Exceptional 10.8% |
| Tongans | 99.4 /100 | #35 | Exceptional 10.8% |
| Cypriots | 99.3 /100 | #36 | Exceptional 10.8% |
| Immigrants | Greece | 99.3 /100 | #37 | Exceptional 10.8% |
| Czechs | 99.3 /100 | #38 | Exceptional 10.8% |
| Immigrants | Pakistan | 99.3 /100 | #39 | Exceptional 10.8% |
| Russians | 99.3 /100 | #40 | Exceptional 10.9% |
| Immigrants | Iran | 99.2 /100 | #41 | Exceptional 10.9% |
| Koreans | 99.2 /100 | #42 | Exceptional 10.9% |
| Immigrants | Singapore | 99.2 /100 | #43 | Exceptional 10.9% |
| Immigrants | Moldova | 99.1 /100 | #44 | Exceptional 10.9% |
| Turks | 98.9 /100 | #45 | Exceptional 11.0% |
| Immigrants | Czechoslovakia | 98.9 /100 | #46 | Exceptional 11.0% |
| Immigrants | Romania | 98.9 /100 | #47 | Exceptional 11.0% |
| Slovenes | 98.9 /100 | #48 | Exceptional 11.0% |
Demographics Similar to Crow by Poverty
In terms of poverty, the demographic groups most similar to Crow are Yup'ik (20.8%, a difference of 0.75%), Hopi (20.8%, a difference of 0.93%), Yuman (20.2%, a difference of 2.2%), Immigrants from Yemen (21.5%, a difference of 4.1%), and Sioux (19.8%, a difference of 4.5%).
| Demographics | Rating | Rank | Poverty |
| Natives/Alaskans | 0.0 /100 | #332 | Tragic 18.1% |
| Houma | 0.0 /100 | #333 | Tragic 18.4% |
| Apache | 0.0 /100 | #334 | Tragic 18.4% |
| Cheyenne | 0.0 /100 | #335 | Tragic 18.9% |
| Pueblo | 0.0 /100 | #336 | Tragic 19.4% |
| Sioux | 0.0 /100 | #337 | Tragic 19.8% |
| Yuman | 0.0 /100 | #338 | Tragic 20.2% |
| Crow | 0.0 /100 | #339 | Tragic 20.7% |
| Yup'ik | 0.0 /100 | #340 | Tragic 20.8% |
| Hopi | 0.0 /100 | #341 | Tragic 20.8% |
| Immigrants | Yemen | 0.0 /100 | #342 | Tragic 21.5% |
| Pima | 0.0 /100 | #343 | Tragic 21.9% |
| Lumbee | 0.0 /100 | #344 | Tragic 21.9% |
| Navajo | 0.0 /100 | #345 | Tragic 23.1% |
| Puerto Ricans | 0.0 /100 | #346 | Tragic 23.7% |