Scotch-Irish vs Crow Receiving Food Stamps
COMPARE
Scotch-Irish
Crow
Receiving Food Stamps
Receiving Food Stamps Comparison
Scotch-Irish
Crow
10.5%
RECEIVING FOOD STAMPS
95.1/ 100
METRIC RATING
114th/ 347
METRIC RANK
13.4%
RECEIVING FOOD STAMPS
1.6/ 100
METRIC RATING
236th/ 347
METRIC RANK
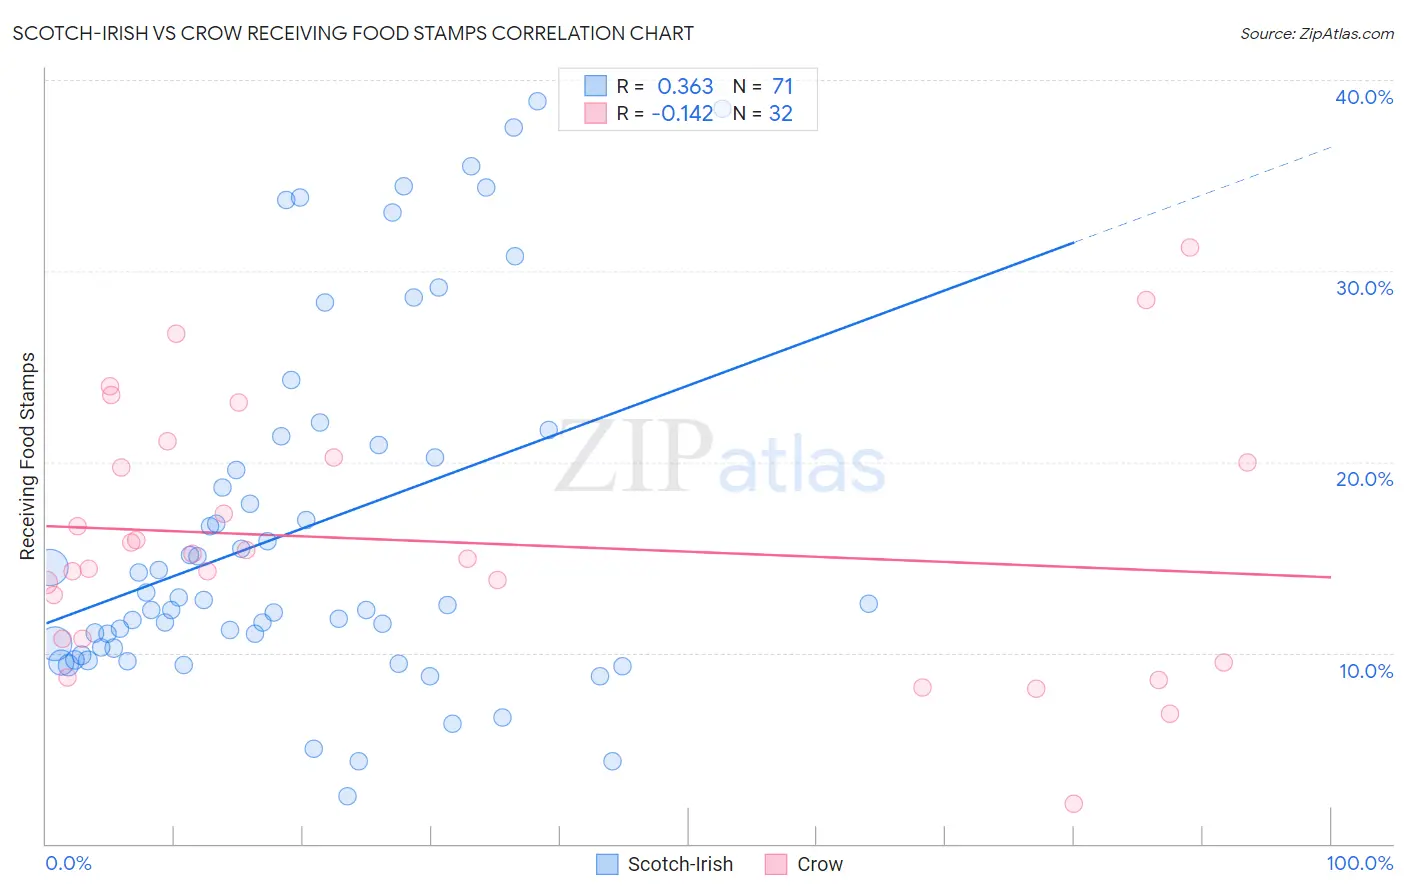
Scotch-Irish vs Crow Receiving Food Stamps Correlation Chart
The statistical analysis conducted on geographies consisting of 546,022,543 people shows a mild positive correlation between the proportion of Scotch-Irish and percentage of population receiving government assistance and/or food stamps in the United States with a correlation coefficient (R) of 0.363 and weighted average of 10.5%. Similarly, the statistical analysis conducted on geographies consisting of 59,190,745 people shows a poor negative correlation between the proportion of Crow and percentage of population receiving government assistance and/or food stamps in the United States with a correlation coefficient (R) of -0.142 and weighted average of 13.4%, a difference of 27.6%.
Receiving Food Stamps Correlation Summary
| Measurement | Scotch-Irish | Crow |
| Minimum | 2.5% | 2.1% |
| Maximum | 38.9% | 31.2% |
| Range | 36.4% | 29.1% |
| Mean | 16.4% | 15.8% |
| Median | 12.6% | 15.0% |
| Interquartile 25% (IQ1) | 10.2% | 10.7% |
| Interquartile 75% (IQ3) | 20.9% | 20.1% |
| Interquartile Range (IQR) | 10.7% | 9.4% |
| Standard Deviation (Sample) | 9.3% | 6.7% |
| Standard Deviation (Population) | 9.2% | 6.6% |
Similar Demographics by Receiving Food Stamps
Demographics Similar to Scotch-Irish by Receiving Food Stamps
In terms of receiving food stamps, the demographic groups most similar to Scotch-Irish are Immigrants from Saudi Arabia (10.5%, a difference of 0.18%), Canadian (10.5%, a difference of 0.22%), Icelander (10.5%, a difference of 0.30%), Immigrants from Nepal (10.6%, a difference of 0.39%), and Mongolian (10.5%, a difference of 0.68%).
| Demographics | Rating | Rank | Receiving Food Stamps |
| Koreans | 96.3 /100 | #107 | Exceptional 10.4% |
| Carpatho Rusyns | 96.2 /100 | #108 | Exceptional 10.4% |
| Immigrants | Pakistan | 96.2 /100 | #109 | Exceptional 10.4% |
| Pakistanis | 95.9 /100 | #110 | Exceptional 10.4% |
| Romanians | 95.8 /100 | #111 | Exceptional 10.4% |
| Mongolians | 95.8 /100 | #112 | Exceptional 10.5% |
| Icelanders | 95.4 /100 | #113 | Exceptional 10.5% |
| Scotch-Irish | 95.1 /100 | #114 | Exceptional 10.5% |
| Immigrants | Saudi Arabia | 94.9 /100 | #115 | Exceptional 10.5% |
| Canadians | 94.8 /100 | #116 | Exceptional 10.5% |
| Immigrants | Nepal | 94.6 /100 | #117 | Exceptional 10.6% |
| Assyrians/Chaldeans/Syriacs | 94.1 /100 | #118 | Exceptional 10.6% |
| Immigrants | Poland | 93.9 /100 | #119 | Exceptional 10.6% |
| Ethiopians | 93.9 /100 | #120 | Exceptional 10.6% |
| Slavs | 93.8 /100 | #121 | Exceptional 10.6% |
Demographics Similar to Crow by Receiving Food Stamps
In terms of receiving food stamps, the demographic groups most similar to Crow are Immigrants from El Salvador (13.5%, a difference of 0.22%), French American Indian (13.5%, a difference of 0.42%), Immigrants from Zaire (13.4%, a difference of 0.44%), Immigrants from Micronesia (13.5%, a difference of 0.65%), and Iroquois (13.5%, a difference of 0.95%).
| Demographics | Rating | Rank | Receiving Food Stamps |
| Ottawa | 3.5 /100 | #229 | Tragic 13.1% |
| Puget Sound Salish | 3.4 /100 | #230 | Tragic 13.1% |
| Immigrants | Nigeria | 3.4 /100 | #231 | Tragic 13.1% |
| Salvadorans | 2.7 /100 | #232 | Tragic 13.2% |
| Cherokee | 2.5 /100 | #233 | Tragic 13.2% |
| Comanche | 2.4 /100 | #234 | Tragic 13.3% |
| Immigrants | Zaire | 1.9 /100 | #235 | Tragic 13.4% |
| Crow | 1.6 /100 | #236 | Tragic 13.4% |
| Immigrants | El Salvador | 1.5 /100 | #237 | Tragic 13.5% |
| French American Indians | 1.4 /100 | #238 | Tragic 13.5% |
| Immigrants | Micronesia | 1.3 /100 | #239 | Tragic 13.5% |
| Iroquois | 1.2 /100 | #240 | Tragic 13.5% |
| Choctaw | 1.0 /100 | #241 | Tragic 13.6% |
| Immigrants | Panama | 1.0 /100 | #242 | Tragic 13.6% |
| Somalis | 0.9 /100 | #243 | Tragic 13.7% |