Immigrants from Dominica vs Crow Poverty
COMPARE
Immigrants from Dominica
Crow
Poverty
Poverty Comparison
Immigrants from Dominica
Crow
16.1%
POVERTY
0.0/ 100
METRIC RATING
318th/ 347
METRIC RANK
20.7%
POVERTY
0.0/ 100
METRIC RATING
339th/ 347
METRIC RANK
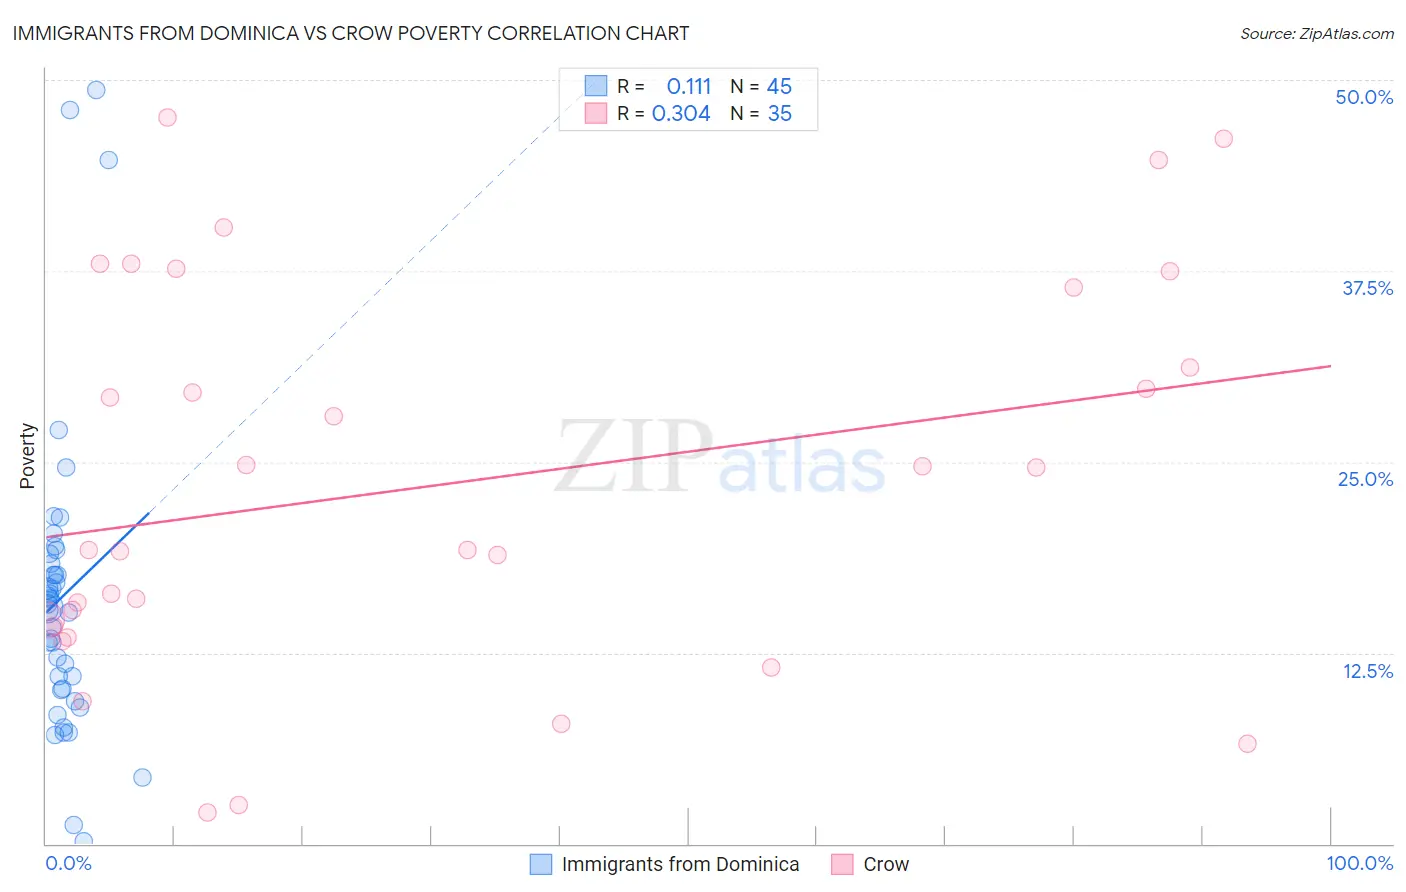
Immigrants from Dominica vs Crow Poverty Correlation Chart
The statistical analysis conducted on geographies consisting of 83,789,226 people shows a poor positive correlation between the proportion of Immigrants from Dominica and poverty level in the United States with a correlation coefficient (R) of 0.111 and weighted average of 16.1%. Similarly, the statistical analysis conducted on geographies consisting of 59,200,262 people shows a mild positive correlation between the proportion of Crow and poverty level in the United States with a correlation coefficient (R) of 0.304 and weighted average of 20.7%, a difference of 28.3%.
Poverty Correlation Summary
| Measurement | Immigrants from Dominica | Crow |
| Minimum | 0.13% | 2.1% |
| Maximum | 49.3% | 47.5% |
| Range | 49.2% | 45.4% |
| Mean | 16.2% | 23.5% |
| Median | 15.5% | 19.2% |
| Interquartile 25% (IQ1) | 10.1% | 14.3% |
| Interquartile 75% (IQ3) | 18.7% | 36.4% |
| Interquartile Range (IQR) | 8.6% | 22.1% |
| Standard Deviation (Sample) | 10.1% | 12.7% |
| Standard Deviation (Population) | 10.0% | 12.5% |
Similar Demographics by Poverty
Demographics Similar to Immigrants from Dominica by Poverty
In terms of poverty, the demographic groups most similar to Immigrants from Dominica are Immigrants from Congo (16.1%, a difference of 0.20%), U.S. Virgin Islander (16.1%, a difference of 0.29%), Immigrants from Honduras (16.2%, a difference of 0.43%), Arapaho (16.3%, a difference of 1.2%), and British West Indian (15.9%, a difference of 1.5%).
| Demographics | Rating | Rank | Poverty |
| Chippewa | 0.0 /100 | #311 | Tragic 15.7% |
| Cajuns | 0.0 /100 | #312 | Tragic 15.7% |
| Immigrants | Grenada | 0.0 /100 | #313 | Tragic 15.8% |
| Immigrants | Somalia | 0.0 /100 | #314 | Tragic 15.8% |
| British West Indians | 0.0 /100 | #315 | Tragic 15.9% |
| Hondurans | 0.0 /100 | #316 | Tragic 15.9% |
| U.S. Virgin Islanders | 0.0 /100 | #317 | Tragic 16.1% |
| Immigrants | Dominica | 0.0 /100 | #318 | Tragic 16.1% |
| Immigrants | Congo | 0.0 /100 | #319 | Tragic 16.1% |
| Immigrants | Honduras | 0.0 /100 | #320 | Tragic 16.2% |
| Arapaho | 0.0 /100 | #321 | Tragic 16.3% |
| Menominee | 0.0 /100 | #322 | Tragic 16.4% |
| Colville | 0.0 /100 | #323 | Tragic 16.6% |
| Yakama | 0.0 /100 | #324 | Tragic 16.7% |
| Central American Indians | 0.0 /100 | #325 | Tragic 16.7% |
Demographics Similar to Crow by Poverty
In terms of poverty, the demographic groups most similar to Crow are Yup'ik (20.8%, a difference of 0.75%), Hopi (20.8%, a difference of 0.93%), Yuman (20.2%, a difference of 2.2%), Immigrants from Yemen (21.5%, a difference of 4.1%), and Sioux (19.8%, a difference of 4.5%).
| Demographics | Rating | Rank | Poverty |
| Natives/Alaskans | 0.0 /100 | #332 | Tragic 18.1% |
| Houma | 0.0 /100 | #333 | Tragic 18.4% |
| Apache | 0.0 /100 | #334 | Tragic 18.4% |
| Cheyenne | 0.0 /100 | #335 | Tragic 18.9% |
| Pueblo | 0.0 /100 | #336 | Tragic 19.4% |
| Sioux | 0.0 /100 | #337 | Tragic 19.8% |
| Yuman | 0.0 /100 | #338 | Tragic 20.2% |
| Crow | 0.0 /100 | #339 | Tragic 20.7% |
| Yup'ik | 0.0 /100 | #340 | Tragic 20.8% |
| Hopi | 0.0 /100 | #341 | Tragic 20.8% |
| Immigrants | Yemen | 0.0 /100 | #342 | Tragic 21.5% |
| Pima | 0.0 /100 | #343 | Tragic 21.9% |
| Lumbee | 0.0 /100 | #344 | Tragic 21.9% |
| Navajo | 0.0 /100 | #345 | Tragic 23.1% |
| Puerto Ricans | 0.0 /100 | #346 | Tragic 23.7% |