Trinidadian and Tobagonian vs Crow Poverty
COMPARE
Trinidadian and Tobagonian
Crow
Poverty
Poverty Comparison
Trinidadians and Tobagonians
Crow
14.3%
POVERTY
0.1/ 100
METRIC RATING
257th/ 347
METRIC RANK
20.7%
POVERTY
0.0/ 100
METRIC RATING
339th/ 347
METRIC RANK
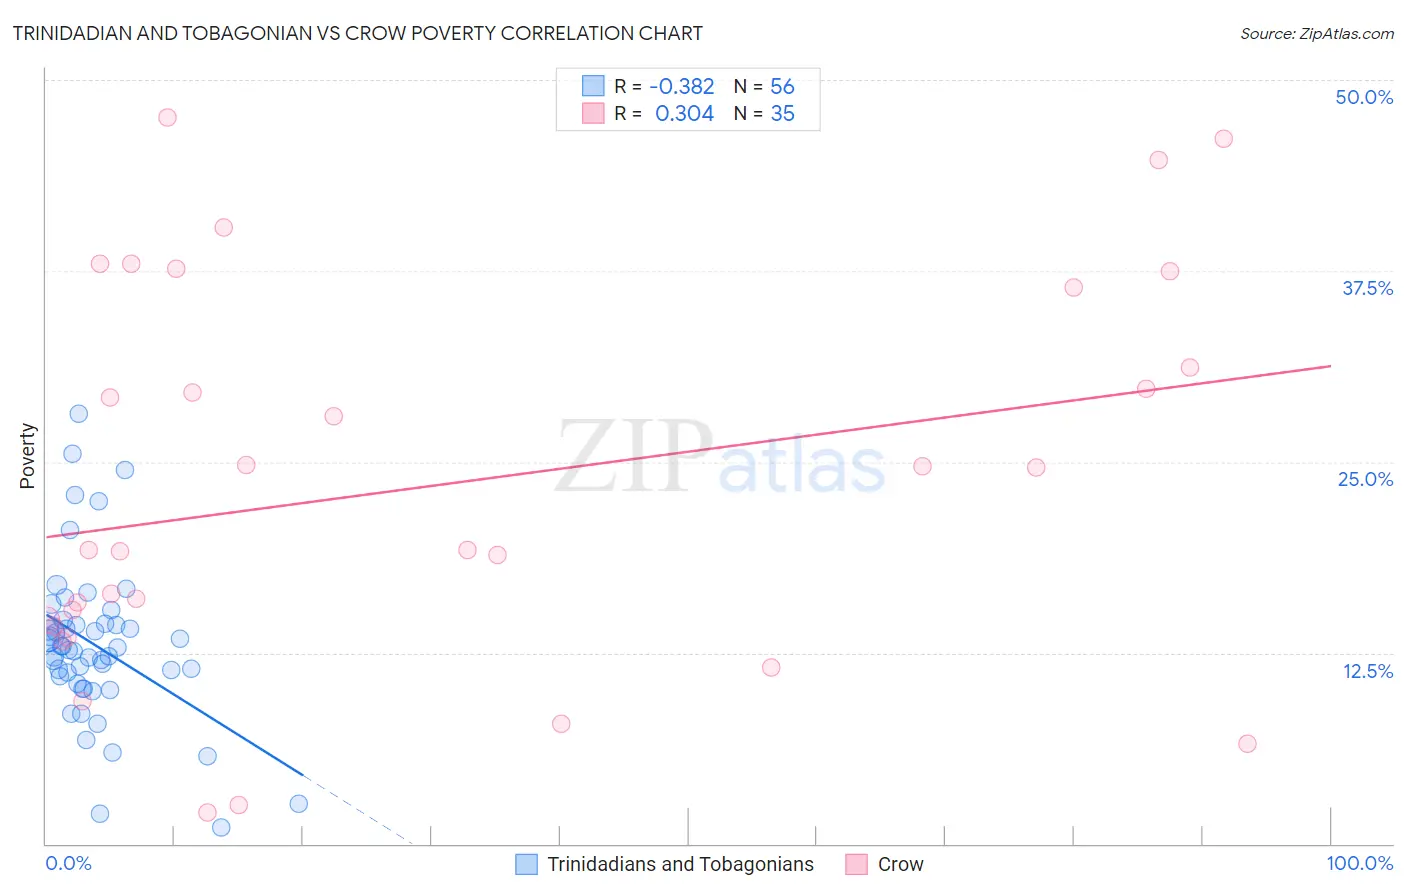
Trinidadian and Tobagonian vs Crow Poverty Correlation Chart
The statistical analysis conducted on geographies consisting of 219,718,536 people shows a mild negative correlation between the proportion of Trinidadians and Tobagonians and poverty level in the United States with a correlation coefficient (R) of -0.382 and weighted average of 14.3%. Similarly, the statistical analysis conducted on geographies consisting of 59,200,262 people shows a mild positive correlation between the proportion of Crow and poverty level in the United States with a correlation coefficient (R) of 0.304 and weighted average of 20.7%, a difference of 44.5%.
Poverty Correlation Summary
| Measurement | Trinidadian and Tobagonian | Crow |
| Minimum | 1.0% | 2.1% |
| Maximum | 28.1% | 47.5% |
| Range | 27.1% | 45.4% |
| Mean | 13.0% | 23.5% |
| Median | 12.8% | 19.2% |
| Interquartile 25% (IQ1) | 10.7% | 14.3% |
| Interquartile 75% (IQ3) | 14.4% | 36.4% |
| Interquartile Range (IQR) | 3.7% | 22.1% |
| Standard Deviation (Sample) | 5.2% | 12.7% |
| Standard Deviation (Population) | 5.1% | 12.5% |
Similar Demographics by Poverty
Demographics Similar to Trinidadians and Tobagonians by Poverty
In terms of poverty, the demographic groups most similar to Trinidadians and Tobagonians are Ottawa (14.3%, a difference of 0.010%), Mexican American Indian (14.3%, a difference of 0.040%), Immigrants from Ecuador (14.3%, a difference of 0.060%), Immigrants from El Salvador (14.3%, a difference of 0.16%), and Immigrants from Nicaragua (14.3%, a difference of 0.28%).
| Demographics | Rating | Rank | Poverty |
| Cree | 0.2 /100 | #250 | Tragic 14.2% |
| Immigrants | Burma/Myanmar | 0.2 /100 | #251 | Tragic 14.2% |
| Spanish American Indians | 0.2 /100 | #252 | Tragic 14.2% |
| Immigrants | Trinidad and Tobago | 0.2 /100 | #253 | Tragic 14.2% |
| Immigrants | El Salvador | 0.1 /100 | #254 | Tragic 14.3% |
| Immigrants | Ecuador | 0.1 /100 | #255 | Tragic 14.3% |
| Mexican American Indians | 0.1 /100 | #256 | Tragic 14.3% |
| Trinidadians and Tobagonians | 0.1 /100 | #257 | Tragic 14.3% |
| Ottawa | 0.1 /100 | #258 | Tragic 14.3% |
| Immigrants | Nicaragua | 0.1 /100 | #259 | Tragic 14.3% |
| Cape Verdeans | 0.1 /100 | #260 | Tragic 14.4% |
| Cherokee | 0.1 /100 | #261 | Tragic 14.4% |
| Immigrants | Liberia | 0.1 /100 | #262 | Tragic 14.4% |
| Jamaicans | 0.1 /100 | #263 | Tragic 14.4% |
| Immigrants | Jamaica | 0.1 /100 | #264 | Tragic 14.4% |
Demographics Similar to Crow by Poverty
In terms of poverty, the demographic groups most similar to Crow are Yup'ik (20.8%, a difference of 0.75%), Hopi (20.8%, a difference of 0.93%), Yuman (20.2%, a difference of 2.2%), Immigrants from Yemen (21.5%, a difference of 4.1%), and Sioux (19.8%, a difference of 4.5%).
| Demographics | Rating | Rank | Poverty |
| Natives/Alaskans | 0.0 /100 | #332 | Tragic 18.1% |
| Houma | 0.0 /100 | #333 | Tragic 18.4% |
| Apache | 0.0 /100 | #334 | Tragic 18.4% |
| Cheyenne | 0.0 /100 | #335 | Tragic 18.9% |
| Pueblo | 0.0 /100 | #336 | Tragic 19.4% |
| Sioux | 0.0 /100 | #337 | Tragic 19.8% |
| Yuman | 0.0 /100 | #338 | Tragic 20.2% |
| Crow | 0.0 /100 | #339 | Tragic 20.7% |
| Yup'ik | 0.0 /100 | #340 | Tragic 20.8% |
| Hopi | 0.0 /100 | #341 | Tragic 20.8% |
| Immigrants | Yemen | 0.0 /100 | #342 | Tragic 21.5% |
| Pima | 0.0 /100 | #343 | Tragic 21.9% |
| Lumbee | 0.0 /100 | #344 | Tragic 21.9% |
| Navajo | 0.0 /100 | #345 | Tragic 23.1% |
| Puerto Ricans | 0.0 /100 | #346 | Tragic 23.7% |