Scotch-Irish vs Laotian Poverty
COMPARE
Scotch-Irish
Laotian
Poverty
Poverty Comparison
Scotch-Irish
Laotians
12.2%
POVERTY
62.6/ 100
METRIC RATING
156th/ 347
METRIC RANK
11.6%
POVERTY
92.4/ 100
METRIC RATING
102nd/ 347
METRIC RANK
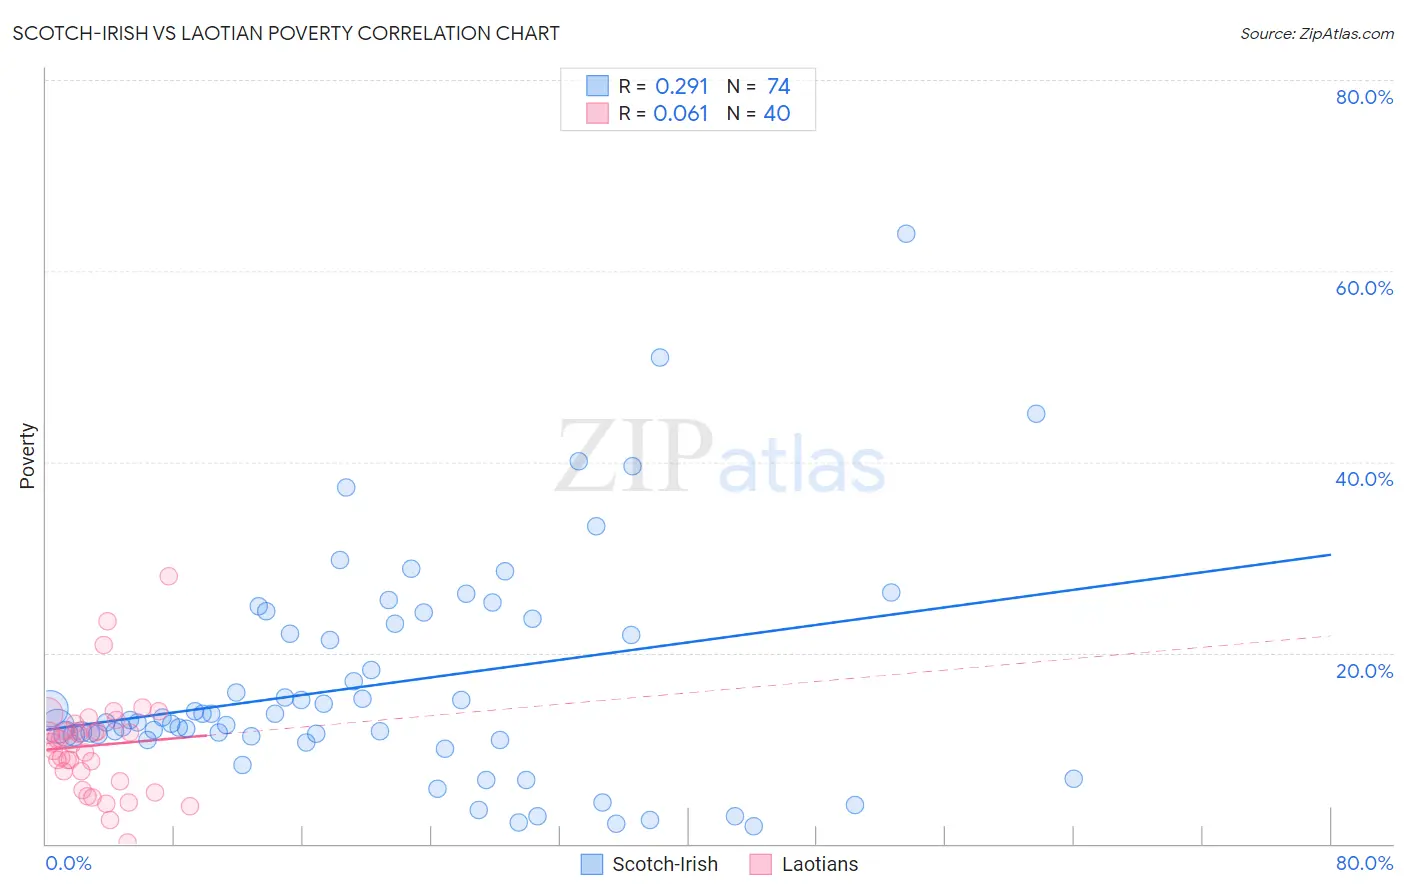
Scotch-Irish vs Laotian Poverty Correlation Chart
The statistical analysis conducted on geographies consisting of 548,217,294 people shows a weak positive correlation between the proportion of Scotch-Irish and poverty level in the United States with a correlation coefficient (R) of 0.291 and weighted average of 12.2%. Similarly, the statistical analysis conducted on geographies consisting of 224,750,373 people shows a slight positive correlation between the proportion of Laotians and poverty level in the United States with a correlation coefficient (R) of 0.061 and weighted average of 11.6%, a difference of 5.1%.
Poverty Correlation Summary
| Measurement | Scotch-Irish | Laotian |
| Minimum | 1.8% | 0.072% |
| Maximum | 63.9% | 28.0% |
| Range | 62.1% | 27.9% |
| Mean | 16.7% | 10.3% |
| Median | 12.9% | 10.5% |
| Interquartile 25% (IQ1) | 11.3% | 7.1% |
| Interquartile 75% (IQ3) | 23.0% | 12.2% |
| Interquartile Range (IQR) | 11.7% | 5.1% |
| Standard Deviation (Sample) | 11.7% | 5.3% |
| Standard Deviation (Population) | 11.6% | 5.3% |
Similar Demographics by Poverty
Demographics Similar to Scotch-Irish by Poverty
In terms of poverty, the demographic groups most similar to Scotch-Irish are Costa Rican (12.2%, a difference of 0.040%), Taiwanese (12.2%, a difference of 0.080%), Hungarian (12.2%, a difference of 0.11%), Guamanian/Chamorro (12.1%, a difference of 0.14%), and Immigrants from Northern Africa (12.1%, a difference of 0.15%).
| Demographics | Rating | Rank | Poverty |
| Immigrants | Malaysia | 72.7 /100 | #149 | Good 12.0% |
| Immigrants | Kazakhstan | 72.3 /100 | #150 | Good 12.0% |
| Samoans | 71.9 /100 | #151 | Good 12.0% |
| Armenians | 67.6 /100 | #152 | Good 12.1% |
| Immigrants | Northern Africa | 63.9 /100 | #153 | Good 12.1% |
| Guamanians/Chamorros | 63.9 /100 | #154 | Good 12.1% |
| Hungarians | 63.6 /100 | #155 | Good 12.2% |
| Scotch-Irish | 62.6 /100 | #156 | Good 12.2% |
| Costa Ricans | 62.2 /100 | #157 | Good 12.2% |
| Taiwanese | 61.8 /100 | #158 | Good 12.2% |
| Pennsylvania Germans | 60.8 /100 | #159 | Good 12.2% |
| Immigrants | Nepal | 60.4 /100 | #160 | Good 12.2% |
| Immigrants | Fiji | 59.1 /100 | #161 | Average 12.2% |
| Ethiopians | 59.1 /100 | #162 | Average 12.2% |
| Immigrants | Ethiopia | 58.6 /100 | #163 | Average 12.2% |
Demographics Similar to Laotians by Poverty
In terms of poverty, the demographic groups most similar to Laotians are Okinawan (11.6%, a difference of 0.010%), Native Hawaiian (11.6%, a difference of 0.11%), Portuguese (11.6%, a difference of 0.13%), Immigrants from Zimbabwe (11.6%, a difference of 0.13%), and Palestinian (11.6%, a difference of 0.22%).
| Demographics | Rating | Rank | Poverty |
| Australians | 94.9 /100 | #95 | Exceptional 11.4% |
| Immigrants | South Africa | 94.7 /100 | #96 | Exceptional 11.5% |
| Immigrants | Egypt | 94.6 /100 | #97 | Exceptional 11.5% |
| Immigrants | Latvia | 94.5 /100 | #98 | Exceptional 11.5% |
| Immigrants | Indonesia | 94.2 /100 | #99 | Exceptional 11.5% |
| Scottish | 94.0 /100 | #100 | Exceptional 11.5% |
| Slavs | 93.3 /100 | #101 | Exceptional 11.5% |
| Laotians | 92.4 /100 | #102 | Exceptional 11.6% |
| Okinawans | 92.4 /100 | #103 | Exceptional 11.6% |
| Native Hawaiians | 92.1 /100 | #104 | Exceptional 11.6% |
| Portuguese | 92.1 /100 | #105 | Exceptional 11.6% |
| Immigrants | Zimbabwe | 92.1 /100 | #106 | Exceptional 11.6% |
| Palestinians | 91.8 /100 | #107 | Exceptional 11.6% |
| Canadians | 91.7 /100 | #108 | Exceptional 11.6% |
| Immigrants | Turkey | 91.7 /100 | #109 | Exceptional 11.6% |