Scotch-Irish vs Immigrants from Dominica Poverty
COMPARE
Scotch-Irish
Immigrants from Dominica
Poverty
Poverty Comparison
Scotch-Irish
Immigrants from Dominica
12.2%
POVERTY
62.6/ 100
METRIC RATING
156th/ 347
METRIC RANK
16.1%
POVERTY
0.0/ 100
METRIC RATING
318th/ 347
METRIC RANK
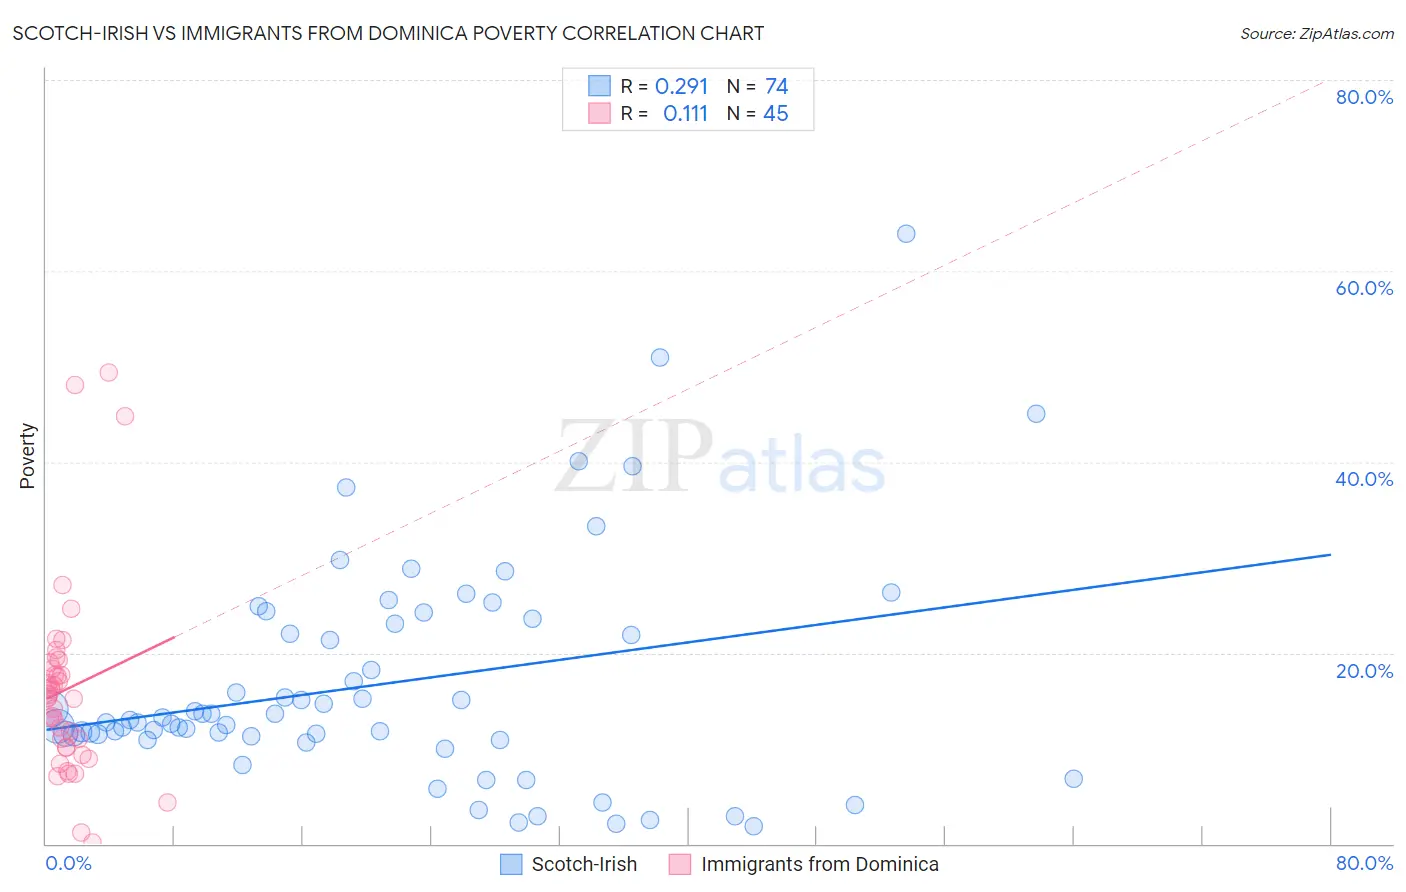
Scotch-Irish vs Immigrants from Dominica Poverty Correlation Chart
The statistical analysis conducted on geographies consisting of 548,217,294 people shows a weak positive correlation between the proportion of Scotch-Irish and poverty level in the United States with a correlation coefficient (R) of 0.291 and weighted average of 12.2%. Similarly, the statistical analysis conducted on geographies consisting of 83,789,226 people shows a poor positive correlation between the proportion of Immigrants from Dominica and poverty level in the United States with a correlation coefficient (R) of 0.111 and weighted average of 16.1%, a difference of 32.4%.
Poverty Correlation Summary
| Measurement | Scotch-Irish | Immigrants from Dominica |
| Minimum | 1.8% | 0.13% |
| Maximum | 63.9% | 49.3% |
| Range | 62.1% | 49.2% |
| Mean | 16.7% | 16.2% |
| Median | 12.9% | 15.5% |
| Interquartile 25% (IQ1) | 11.3% | 10.1% |
| Interquartile 75% (IQ3) | 23.0% | 18.7% |
| Interquartile Range (IQR) | 11.7% | 8.6% |
| Standard Deviation (Sample) | 11.7% | 10.1% |
| Standard Deviation (Population) | 11.6% | 10.0% |
Similar Demographics by Poverty
Demographics Similar to Scotch-Irish by Poverty
In terms of poverty, the demographic groups most similar to Scotch-Irish are Costa Rican (12.2%, a difference of 0.040%), Taiwanese (12.2%, a difference of 0.080%), Hungarian (12.2%, a difference of 0.11%), Guamanian/Chamorro (12.1%, a difference of 0.14%), and Immigrants from Northern Africa (12.1%, a difference of 0.15%).
| Demographics | Rating | Rank | Poverty |
| Immigrants | Malaysia | 72.7 /100 | #149 | Good 12.0% |
| Immigrants | Kazakhstan | 72.3 /100 | #150 | Good 12.0% |
| Samoans | 71.9 /100 | #151 | Good 12.0% |
| Armenians | 67.6 /100 | #152 | Good 12.1% |
| Immigrants | Northern Africa | 63.9 /100 | #153 | Good 12.1% |
| Guamanians/Chamorros | 63.9 /100 | #154 | Good 12.1% |
| Hungarians | 63.6 /100 | #155 | Good 12.2% |
| Scotch-Irish | 62.6 /100 | #156 | Good 12.2% |
| Costa Ricans | 62.2 /100 | #157 | Good 12.2% |
| Taiwanese | 61.8 /100 | #158 | Good 12.2% |
| Pennsylvania Germans | 60.8 /100 | #159 | Good 12.2% |
| Immigrants | Nepal | 60.4 /100 | #160 | Good 12.2% |
| Immigrants | Fiji | 59.1 /100 | #161 | Average 12.2% |
| Ethiopians | 59.1 /100 | #162 | Average 12.2% |
| Immigrants | Ethiopia | 58.6 /100 | #163 | Average 12.2% |
Demographics Similar to Immigrants from Dominica by Poverty
In terms of poverty, the demographic groups most similar to Immigrants from Dominica are Immigrants from Congo (16.1%, a difference of 0.20%), U.S. Virgin Islander (16.1%, a difference of 0.29%), Immigrants from Honduras (16.2%, a difference of 0.43%), Arapaho (16.3%, a difference of 1.2%), and British West Indian (15.9%, a difference of 1.5%).
| Demographics | Rating | Rank | Poverty |
| Chippewa | 0.0 /100 | #311 | Tragic 15.7% |
| Cajuns | 0.0 /100 | #312 | Tragic 15.7% |
| Immigrants | Grenada | 0.0 /100 | #313 | Tragic 15.8% |
| Immigrants | Somalia | 0.0 /100 | #314 | Tragic 15.8% |
| British West Indians | 0.0 /100 | #315 | Tragic 15.9% |
| Hondurans | 0.0 /100 | #316 | Tragic 15.9% |
| U.S. Virgin Islanders | 0.0 /100 | #317 | Tragic 16.1% |
| Immigrants | Dominica | 0.0 /100 | #318 | Tragic 16.1% |
| Immigrants | Congo | 0.0 /100 | #319 | Tragic 16.1% |
| Immigrants | Honduras | 0.0 /100 | #320 | Tragic 16.2% |
| Arapaho | 0.0 /100 | #321 | Tragic 16.3% |
| Menominee | 0.0 /100 | #322 | Tragic 16.4% |
| Colville | 0.0 /100 | #323 | Tragic 16.6% |
| Yakama | 0.0 /100 | #324 | Tragic 16.7% |
| Central American Indians | 0.0 /100 | #325 | Tragic 16.7% |